

Quantitative Studies of Alluvial Architecture
335
20
A
- 6
B
:[ 16
5
.
.
:a 12
�
c 4
c
jj
;;
£ 8
.,.· .,., .
£
••
.
.
x
x 2
· . ..
•
� 4
"
.,;';•
0.5
0 1
0
40
80
120
160 200 240 280
100
1000
10000
Width {m)
Width {m)
4
6
c
D
g
3
§
�
. 4
•
�
c 2
c
�
£
:
£ 2
• ..
•
x
x
..
•
•,
•
.o. � AA
"
'
"
0 •
0
0 20 40 60 80 100 120 140 160 180 200
5
25
50
75
Width (m)
Width (m)
9.5
10
E
F
g 8
i a
•
�
� 6
.
•
6
c
:,.
c
jj
�
.9
£ 4
£ 4
x
x
•
. .
!1 2
" 2
. ..
-
0
5
20
40
60
75
0 100 200 300 400 500 600 700 800 900
Width (m)
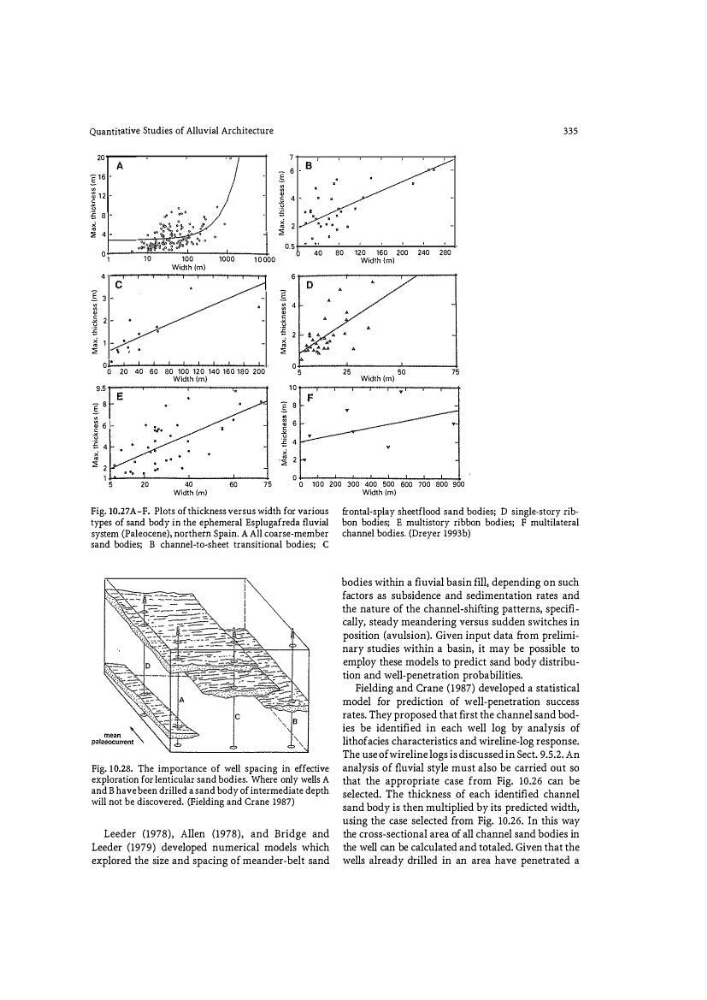
Fig. 10.27 A-F. Plots of thickness versus width for various
types of sand body in the ephemeral Esplugafreda fluvial
system (Paleocene), northern Spain. A All coarse-member
sand bodies; B channel-to-sheet transitional bodies; C
Fig. 10.28. The importance of well spacing in effective
exploration for lenticular sand bodies. Where only wells A
and B have been drilled a sand body of intermediate depth
will not be discovered. (Fielding and Crane 1987)
Leeder (1978), Allen (1978), and Bridge and
Leeder (1979) developed numerical models which
explored the size and spacing of meander-belt sand
Width {m)
fr ontal-splay sheetflood sand bodies; D single-story ribbon bodies; E multistory ribbon bodies; F multilateral
channel bodies. (Dreyer 1993b)
bodies within a fl uvial basin fill, depending on such
factors as subsidence and sedimentation rates and
the nature of the channel-shifting patterns, specifically, steady meandering versus sudden switches in
position (avulsion). Given input data fr om preliminary studies within a basin, it may be possible to
employ these models to predict sand body distribution and well-penetration probabilities.
Fielding and Crane (1987) developed a statistical
model fo r prediction of well-penetration success
rates. They proposed that first the channel sand bodies be identified in each well log by analysis of
lithofacies characteristics and wireline-log response.
The use ofwireline logs is discussed in Sect. 9.5.2. An
analysis of fluvial style must also be carried out so
that the appropriate case from Fig. 10.26 can be
selected. The thickness of each identifi ed channel
sand body is then multiplied by its predicted width,
using the case selected from Fig. 10.26. In this way
the cross-sectional area of all channel sand bodies in
the well can be calculated and totaled. Given that the
wells already drilled in an area have penetrated a
335
20
A
- 6
B
:[ 16
5
.
.
:a 12
�
c 4
c
jj
;;
£ 8
.,.· .,., .
£
••
.
.
x
x 2
· . ..
•
� 4
"
.,;';•
0.5
0 1
0
40
80
120
160 200 240 280
100
1000
10000
Width {m)
Width {m)
4
6
c
D
g
3
§
�
. 4
•
�
c 2
c
�
£
:
£ 2
• ..
•
x
x
..
•
•,
•
.o. � AA
"
'
"
0 •
0
0 20 40 60 80 100 120 140 160 180 200
5
25
50
75
Width (m)
Width (m)
9.5
10
E
F
g 8
i a
•
�
� 6
.
•
6
c
:,.
c
jj
�
.9
£ 4
£ 4
x
x
•
. .
!1 2
" 2
. ..
-
0
5
20
40
60
75
0 100 200 300 400 500 600 700 800 900
Width (m)
Fig. 10.27 A-F. Plots of thickness versus width for various
types of sand body in the ephemeral Esplugafreda fluvial
system (Paleocene), northern Spain. A All coarse-member
sand bodies; B channel-to-sheet transitional bodies; C
Fig. 10.28. The importance of well spacing in effective
exploration for lenticular sand bodies. Where only wells A
and B have been drilled a sand body of intermediate depth
will not be discovered. (Fielding and Crane 1987)
Leeder (1978), Allen (1978), and Bridge and
Leeder (1979) developed numerical models which
explored the size and spacing of meander-belt sand
Width {m)
fr ontal-splay sheetflood sand bodies; D single-story ribbon bodies; E multistory ribbon bodies; F multilateral
channel bodies. (Dreyer 1993b)
bodies within a fl uvial basin fill, depending on such
factors as subsidence and sedimentation rates and
the nature of the channel-shifting patterns, specifically, steady meandering versus sudden switches in
position (avulsion). Given input data fr om preliminary studies within a basin, it may be possible to
employ these models to predict sand body distribution and well-penetration probabilities.
Fielding and Crane (1987) developed a statistical
model fo r prediction of well-penetration success
rates. They proposed that first the channel sand bodies be identified in each well log by analysis of
lithofacies characteristics and wireline-log response.
The use ofwireline logs is discussed in Sect. 9.5.2. An
analysis of fluvial style must also be carried out so
that the appropriate case from Fig. 10.26 can be
selected. The thickness of each identifi ed channel
sand body is then multiplied by its predicted width,
using the case selected from Fig. 10.26. In this way
the cross-sectional area of all channel sand bodies in
the well can be calculated and totaled. Given that the
wells already drilled in an area have penetrated a