

304
The Stratigraphic Architecture of Fluvial Depositional Systems
Kil!ard distributary channel
100 ,--- -- -- -- -.= ==<1 -ill Stack 1
Stack 2
Stack 3
AU stacks
Stack 2+3
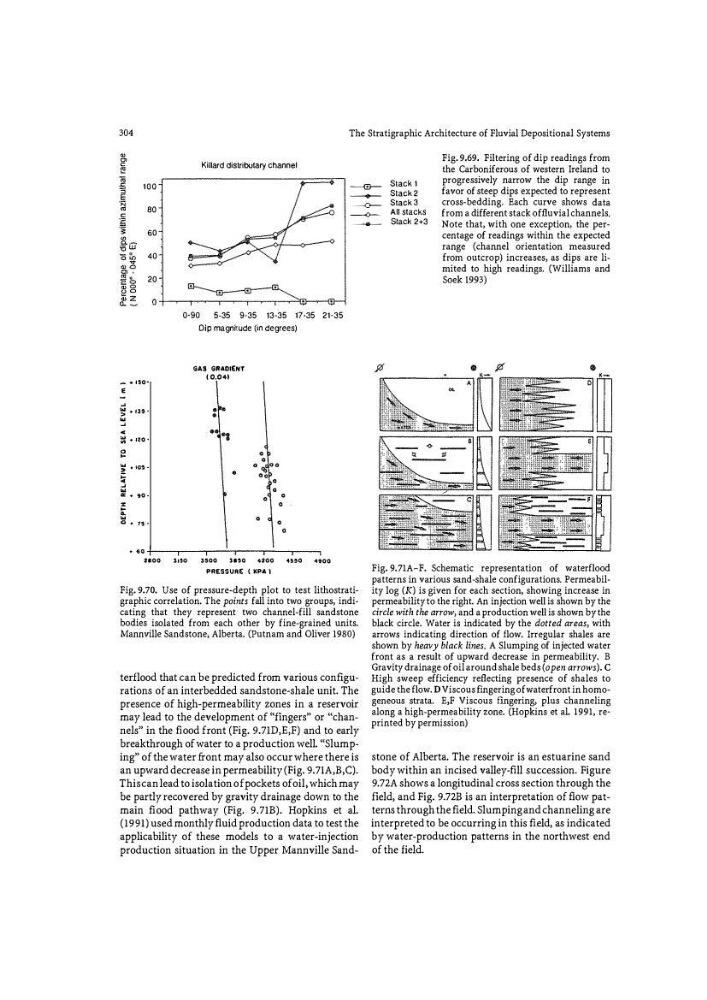
Fig. 9.69. Filtering of dip readings from
the Carboniferous of western Ireland to
progressively narrow the dip range in
favor of steep dips expected to represent
cross-bedding. Each curve shows data
from a different stack of fluvial channels.
Note that, with one exception, the percentage of readings within the expected
range (channel orientation measured
from outcrop) increases, as dips are limited to high readings. (Williams and
Soek !993)
-
80
-
- •1 $0
E
�
�. ,,,
w
�
•
� • 120
e
� •10!1
s
�
w
Ill: • 90
%
�
0 • 1'l
60
40
20
0·90
5·35 9-35 13-35 17 ·35 21-35
Dip magnitude (in degrees)
GAS GRADIENT
(0.041
•
•
•• "1
•
0
0
o q;; oo
Oo
0
0
0
0
0
0
0 0
·•• +--- -.- --,r-�- -- -- -�- -r- --,
2800
ll�O
l$00
1850
4:200
4\\!10
4'11 00
PRESSURE { I
bodies isolated from each other by fine-grained units.
Mannville Sandstone, Alberta. (Putnam and Oliver 1980)
terflood that can be predicted from various configurations of an interbedded sandstone-shale unit. The
presence of high-permeability zones in a reservoir
may lead to the development of «fingers" or <
an upward decrease in permeability (Fig. 9.71A,B,C).
This can lead to isolation of pockets of oil, which may
be partly recovered by gravity drainage down to the
main flood pathway (Fig. 9.71B). Hopkins et al.
(1991) used monthly fluid production data to test the
applicability of these models to a water-injection
production situation in the Upper Mannville SandFig. 9.71A-F. Schematic representation of waterflood
patterns in various sand-shale configurations. Permeability log (K) is given for each section, showing increase in
permeability to the right. An injection well is shown by the
circle with the arrow, and a production well is shown by the
black circle. Water is indicated by the dotted areas, with
arrows indicating direction of flow. Irregular shales are
shown by heavy black lines. A Slumping of injected water
front as a result of upward decrease in permeability. B
Gravity drainage of oil around shale beds (open arrows). C
High sweep efficiency reflecting presence of shales to
guide the flow. D Viscous fingering of waterfront in homogeneous strata. E,F Viscous fingering, plus channeling
along a high-permeability zone. (Hopkins et al. 1991, reprinted by permission)
stone of Alberta. The reservoir is an estuarine sand
body within an incised valley-fi ll succession. Figure
9.72A shows a longitudinal cross section through the
field, and Fig. 9.72B is an interpretation of flow patterns through the fi eld. Slumping and channeling are
interpreted to be occurring in this field, as indicated
by water-production patterns in the northwest end
of the field.
The Stratigraphic Architecture of Fluvial Depositional Systems
Kil!ard distributary channel
100 ,--- -- -- -- -.= ==<1 -ill Stack 1
Stack 2
Stack 3
AU stacks
Stack 2+3
Fig. 9.69. Filtering of dip readings from
the Carboniferous of western Ireland to
progressively narrow the dip range in
favor of steep dips expected to represent
cross-bedding. Each curve shows data
from a different stack of fluvial channels.
Note that, with one exception, the percentage of readings within the expected
range (channel orientation measured
from outcrop) increases, as dips are limited to high readings. (Williams and
Soek !993)
-
80
-
- •1 $0
E
�
�. ,,,
w
�
•
� • 120
e
� •10!1
s
�
w
Ill: • 90
%
�
0 • 1'l
60
40
20
0·90
5·35 9-35 13-35 17 ·35 21-35
Dip magnitude (in degrees)
GAS GRADIENT
(0.041
•
•
•• "1
•
0
0
o q;; oo
Oo
0
0
0
0
0
0
0 0
·•• +--- -.- --,r-�- -- -- -�- -r- --,
2800
ll�O
l$00
1850
4:200
4\\!10
4'11 00
PRESSURE { I
bodies isolated from each other by fine-grained units.
Mannville Sandstone, Alberta. (Putnam and Oliver 1980)
terflood that can be predicted from various configurations of an interbedded sandstone-shale unit. The
presence of high-permeability zones in a reservoir
may lead to the development of «fingers" or <
an upward decrease in permeability (Fig. 9.71A,B,C).
This can lead to isolation of pockets of oil, which may
be partly recovered by gravity drainage down to the
main flood pathway (Fig. 9.71B). Hopkins et al.
(1991) used monthly fluid production data to test the
applicability of these models to a water-injection
production situation in the Upper Mannville SandFig. 9.71A-F. Schematic representation of waterflood
patterns in various sand-shale configurations. Permeability log (K) is given for each section, showing increase in
permeability to the right. An injection well is shown by the
circle with the arrow, and a production well is shown by the
black circle. Water is indicated by the dotted areas, with
arrows indicating direction of flow. Irregular shales are
shown by heavy black lines. A Slumping of injected water
front as a result of upward decrease in permeability. B
Gravity drainage of oil around shale beds (open arrows). C
High sweep efficiency reflecting presence of shales to
guide the flow. D Viscous fingering of waterfront in homogeneous strata. E,F Viscous fingering, plus channeling
along a high-permeability zone. (Hopkins et al. 1991, reprinted by permission)
stone of Alberta. The reservoir is an estuarine sand
body within an incised valley-fi ll succession. Figure
9.72A shows a longitudinal cross section through the
field, and Fig. 9.72B is an interpretation of flow patterns through the fi eld. Slumping and channeling are
interpreted to be occurring in this field, as indicated
by water-production patterns in the northwest end
of the field.