

]vleth ods of Correlation and Mapping
a!VJNSI!�
p!&-�tructuml lt>lntio
____ ,,
" "' "'"'
'
" "' "'"
, - .,
I ,
16
=�
-�
•
"
��
' .
�
" =:z
••
-
-:::-'
" -=303
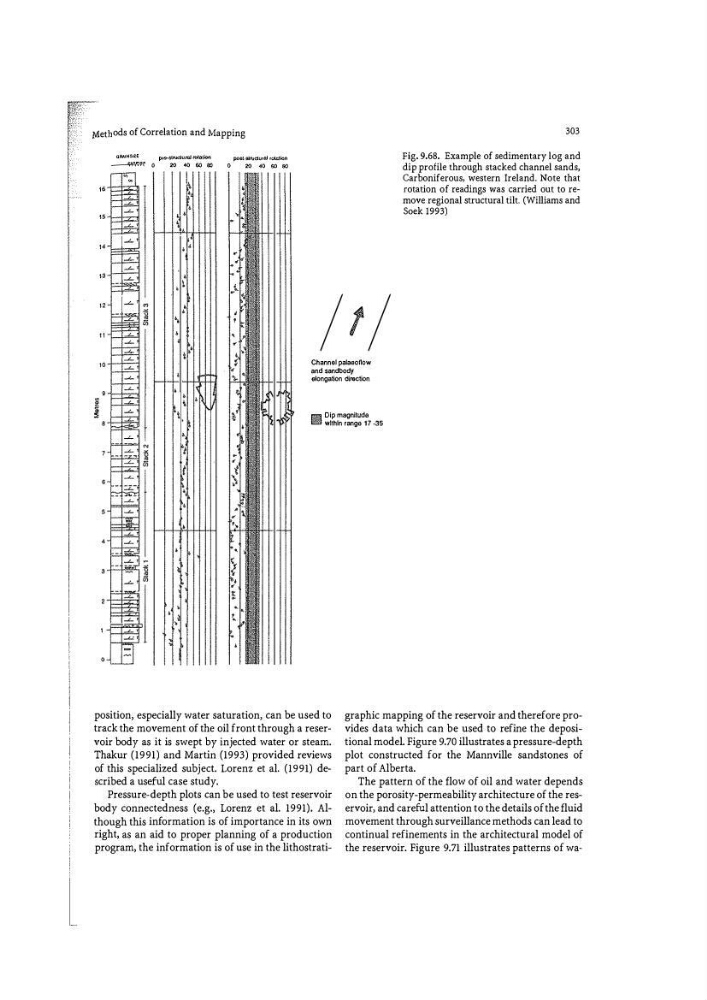
Fig. 9.68. Example of sedimentary log and
dip profile through stacked channel sands,
Carboniferous, western Ireland. Note that
rotation of readings was carried out to remove regional structural tilt. (Williams and
Soek 1993)
-�
"
�
"
•
§� �
•
'•
"
�
•
�
•
�
..
/t/
i
"
�
Channel palaaollow
and sandbody
elongation diMction
=
'
= �
•
*
'
�
t
�
�
i
g Dip magnitude
'
F
9 wl!hln range 17 ·35
�
r �N
I
'F
� �
f=
� �
,F �
l:; �
,F= � �
� �
•
•
,F c¥; •
�
a;
r'
�
2 1-I= �
'
=
' '-- -�
position 1 especially water saturation1 can be used to
track the movement of the oil front through a reservoir body as it is swept by injected water or steam.
Thakur (1991) and Martin (1993) provided reviews
of this specialized subject. Lorenz et al. (1991) described a useful case study.
Pressure� depth plots can be used to test reservoir
body connectedness (e.g., Lorenz et al. 1991). Although this information is of importance in its own
right, as an aid to proper planning of a production
program, the information is of use in the lithostratigraphic mapping of the reservoir and therefore provides data which can be used to refine the depositional model. Figure 9.70 illustrates a pressure-depth
plot constructed for the Mannville sandstones of
part of Alberta.
The pattern of the flow of oil and water depends
on the porosity-permeability architecture of the reservoir1 and careful attention to the details of the fluid
movement through surveillance methods can lead to
continual refinements in the architectural model of
the reservoir. Figure 9.71 illustrates patterns of wa�
a!VJNSI!�
p!&-�tructuml lt>lntio
____ ,,
" "' "'"'
'
" "' "'"
, - .,
I ,
16
=�
-�
•
"
��
' .
�
" =:z
••
-
-:::-'
" -=303
Fig. 9.68. Example of sedimentary log and
dip profile through stacked channel sands,
Carboniferous, western Ireland. Note that
rotation of readings was carried out to remove regional structural tilt. (Williams and
Soek 1993)
-�
"
�
"
•
§� �
•
'•
"
�
•
�
•
�
..
/t/
i
"
�
Channel palaaollow
and sandbody
elongation diMction
=
'
= �
•
*
'
�
t
�
�
i
g Dip magnitude
'
F
9 wl!hln range 17 ·35
�
r �N
I
'F
� �
f=
� �
,F �
l:; �
,F= � �
� �
•
•
,F c¥; •
�
a;
r'
�
2 1-I= �
'
=
' '-- -�
position 1 especially water saturation1 can be used to
track the movement of the oil front through a reservoir body as it is swept by injected water or steam.
Thakur (1991) and Martin (1993) provided reviews
of this specialized subject. Lorenz et al. (1991) described a useful case study.
Pressure� depth plots can be used to test reservoir
body connectedness (e.g., Lorenz et al. 1991). Although this information is of importance in its own
right, as an aid to proper planning of a production
program, the information is of use in the lithostratigraphic mapping of the reservoir and therefore provides data which can be used to refine the depositional model. Figure 9.70 illustrates a pressure-depth
plot constructed for the Mannville sandstones of
part of Alberta.
The pattern of the flow of oil and water depends
on the porosity-permeability architecture of the reservoir1 and careful attention to the details of the fluid
movement through surveillance methods can lead to
continual refinements in the architectural model of
the reservoir. Figure 9.71 illustrates patterns of wa�