

300
The Stratigraphic Architecture of Fluvial Depositional Systems
al Lignite
�j:�:: :::;:;:;:�l Pebble beds
Sands with large·
j
scale crossbedding
""
c:=J Other sands
CAPE VESEY
HAMILTON
0
�
i
0
0
g !:;
0
N
�
N
l
�
�
j
'
'
c
�
""'
""'
]. 0
•
\
t
0"'339
11"'26
L<>96.0
s2 .. 342
/
}�
.
8 .. 42
11"'22
L»88.6
s2,670
Azimuth
Moving av�r�ge Moving aver�ge Moving average
Forese! dip
a�imuth
variance
set thicknesslcm)
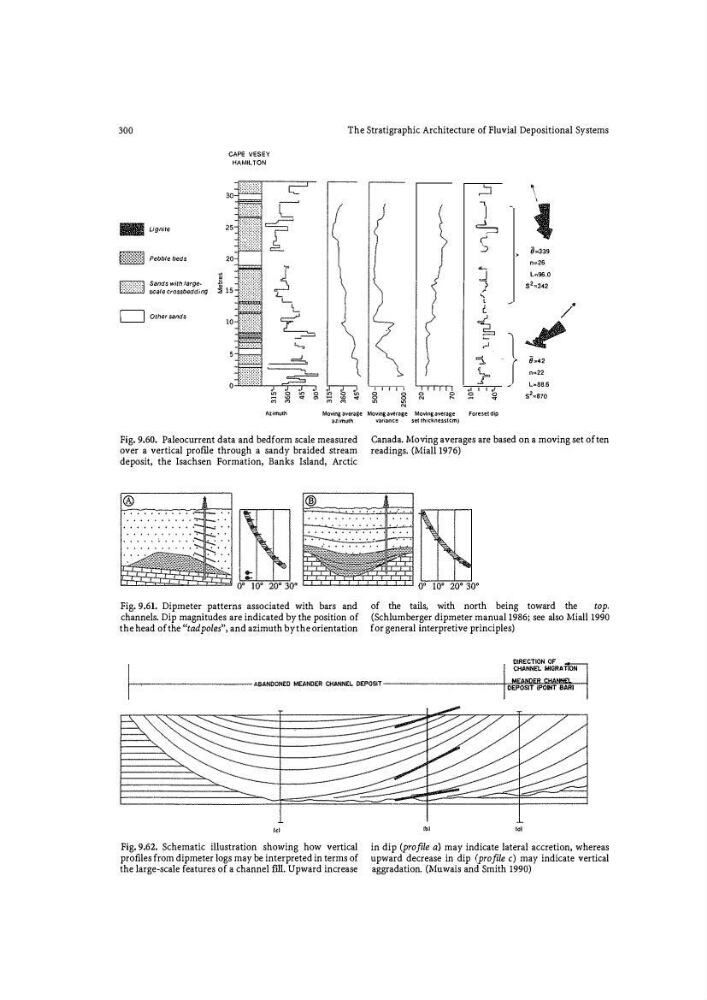
Fig. 9.60. Paleocurrent data and bedform scale measured
over a vertical prof:Ue through a sandy braided stream
deposit, the Isachsen Formation, Banks Island, Arctic
Fig. 9.61. Dipmeter patterns associated with bars and
channels. Dip magnitudes are indicated by the position of
the head of the lltadpold', and azimuth by the orientation
,,,
Fig. 9.62. Schematic illustration showing how vertical
profiles from dipmeter logs may be interpreted in terms of
the large-scale features of a channel fill . Upward increase
Canada. Moving averages are based on a moving set of ten
readings. (Miall l976)
of the tails, 'With north being toward the top.
(Schlumberger dipmeter manual l986; see also Miall !990
for general interpretive principles)
"'
,,,
in dip (profile a} may indicate lateral accretion, whereas
upward decrease in dip (profile c) may indicate vertical
aggradation. (Muwais and Smith 1990)
The Stratigraphic Architecture of Fluvial Depositional Systems
al Lignite
�j:�:: :::;:;:;:�l Pebble beds
Sands with large·
j
scale crossbedding
""
c:=J Other sands
CAPE VESEY
HAMILTON
0
�
i
0
0
g !:;
0
N
�
N
l
�
�
j
'
'
c
�
""'
""'
]. 0
•
\
t
0"'339
11"'26
L<>96.0
s2 .. 342
/
}�
.
8 .. 42
11"'22
L»88.6
s2,670
Azimuth
Moving av�r�ge Moving aver�ge Moving average
Forese! dip
a�imuth
variance
set thicknesslcm)
Fig. 9.60. Paleocurrent data and bedform scale measured
over a vertical prof:Ue through a sandy braided stream
deposit, the Isachsen Formation, Banks Island, Arctic
Fig. 9.61. Dipmeter patterns associated with bars and
channels. Dip magnitudes are indicated by the position of
the head of the lltadpold', and azimuth by the orientation
,,,
Fig. 9.62. Schematic illustration showing how vertical
profiles from dipmeter logs may be interpreted in terms of
the large-scale features of a channel fill . Upward increase
Canada. Moving averages are based on a moving set of ten
readings. (Miall l976)
of the tails, 'With north being toward the top.
(Schlumberger dipmeter manual l986; see also Miall !990
for general interpretive principles)
"'
,,,
in dip (profile a} may indicate lateral accretion, whereas
upward decrease in dip (profile c) may indicate vertical
aggradation. (Muwais and Smith 1990)