

Methods of Correlation and Mapping
trace of
1 � 3 order accretion surfaces
on top of element 2AwDA
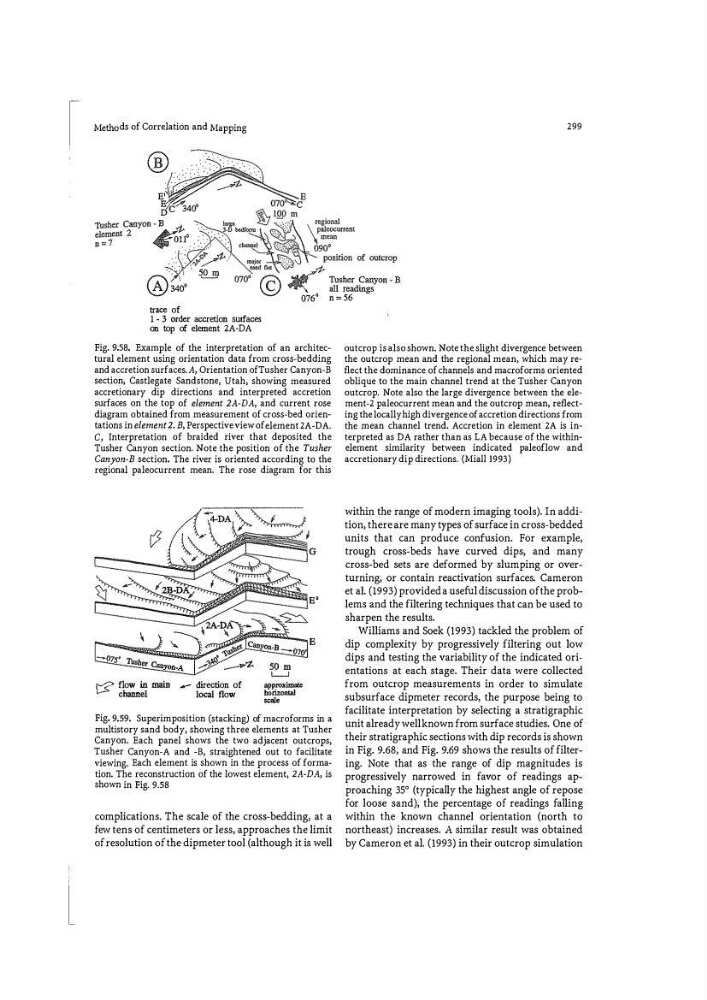
Fig. 9.58. Example of the interpretation of an architec�
tural element using orientation data from cross-bedding
and accretion surfaces. A, Orientation ofTusher Canyon-B
section, Castlegate Sandstone, Utah, showing measured
accretionary dip directions and interpreted accretion
surfaces on the top of element 2A-DA, and current rose
diagram obtained from measurement of cross-bed orienw
tations in element 2. B, Perspective view of element 2A-DA.
C, Interpretation of braided river that deposited the
Tusher Canyon section. Note the position of the Tusher
Canyon-B section. The river is oriented according to the
regional paleocurrent mean. The rose diagram for this
\;?' flow in main .... .- direction of
channel
local flow
approximate
horizontal
""'
Fig. 9.59. Superimposition (stacking) of macro forms in a
multistory sand body, showing three elements at Tusher
Canyon. Each panel shows the two adjacent outcrops,
Tusher Canyon-A and -B, straightened out to facilitate
viewing. Each element is shown in the process of formation. The reconstruction of the lowest element, 2A-DA, is
shown in Fig. 9.58
complications. The scale of the cross-bedding, at a
few tens of centimeters or less, approaches the limit
of resolution of the dipmeter tool (although it is well
299
outcrop is also shown. Note the slight divergence between
the outcrop mean and the regional mean, which may re H
fleet the dominance of channels and macroforms oriented
oblique to the main channel trend at the Tusher Canyon
outcrop. Note also the large divergence between the element-2 paleocurrent mean and the outcrop mean, reflecting the locally high divergence of accretion directions from
the mean channel trend. Accretion in element 2A is inw
terpreted as DA rather than as LA because of the withinelement similarity between indicated paleoflow and
accretionary dip directions. (Miall l993)
within the range of modern imaging tools). In addition, there are many types of surface in cross-bedded
units that can produce confusion. For example,
trough cross-beds have curved dips, and many
cross-bed sets are deformed by slumping or overturning, or contain reactivation surfaces. Cameron
et a!. (!993) provided a useful discussion of the problems and the filtering techniques that can be used to
sharpen the results.
Williams and Soek (1993) tackled the problem of
dip complexity by progressively filtering out low
dips and testing the variability of the indicated oriw
entations at each stage. Their data were collected
from outcrop measurements in order to simulate
subsurface dipmeter records, the purpose being to
facilitate interpretation by selecting a stratigraphic
unit already well known from surface studies. One of
their stratigraphic sections with dip records is shown
in Fig. 9.68, and Fig. 9.69 shows the results of filtering. Note that as the range of dip magnitudes is
progressively narrowed in favor of readings approaching 35° (typically the highest angle of repose
for loose sand), the percentage of readings falling
within the known channel orientation (north to
northeast) increases. A similar result was obtained
by Cameron et al. {1993) in their outcrop simulation
trace of
1 � 3 order accretion surfaces
on top of element 2AwDA
Fig. 9.58. Example of the interpretation of an architec�
tural element using orientation data from cross-bedding
and accretion surfaces. A, Orientation ofTusher Canyon-B
section, Castlegate Sandstone, Utah, showing measured
accretionary dip directions and interpreted accretion
surfaces on the top of element 2A-DA, and current rose
diagram obtained from measurement of cross-bed orienw
tations in element 2. B, Perspective view of element 2A-DA.
C, Interpretation of braided river that deposited the
Tusher Canyon section. Note the position of the Tusher
Canyon-B section. The river is oriented according to the
regional paleocurrent mean. The rose diagram for this
\;?' flow in main .... .- direction of
channel
local flow
approximate
horizontal
""'
Fig. 9.59. Superimposition (stacking) of macro forms in a
multistory sand body, showing three elements at Tusher
Canyon. Each panel shows the two adjacent outcrops,
Tusher Canyon-A and -B, straightened out to facilitate
viewing. Each element is shown in the process of formation. The reconstruction of the lowest element, 2A-DA, is
shown in Fig. 9.58
complications. The scale of the cross-bedding, at a
few tens of centimeters or less, approaches the limit
of resolution of the dipmeter tool (although it is well
299
outcrop is also shown. Note the slight divergence between
the outcrop mean and the regional mean, which may re H
fleet the dominance of channels and macroforms oriented
oblique to the main channel trend at the Tusher Canyon
outcrop. Note also the large divergence between the element-2 paleocurrent mean and the outcrop mean, reflecting the locally high divergence of accretion directions from
the mean channel trend. Accretion in element 2A is inw
terpreted as DA rather than as LA because of the withinelement similarity between indicated paleoflow and
accretionary dip directions. (Miall l993)
within the range of modern imaging tools). In addition, there are many types of surface in cross-bedded
units that can produce confusion. For example,
trough cross-beds have curved dips, and many
cross-bed sets are deformed by slumping or overturning, or contain reactivation surfaces. Cameron
et a!. (!993) provided a useful discussion of the problems and the filtering techniques that can be used to
sharpen the results.
Williams and Soek (1993) tackled the problem of
dip complexity by progressively filtering out low
dips and testing the variability of the indicated oriw
entations at each stage. Their data were collected
from outcrop measurements in order to simulate
subsurface dipmeter records, the purpose being to
facilitate interpretation by selecting a stratigraphic
unit already well known from surface studies. One of
their stratigraphic sections with dip records is shown
in Fig. 9.68, and Fig. 9.69 shows the results of filtering. Note that as the range of dip magnitudes is
progressively narrowed in favor of readings approaching 35° (typically the highest angle of repose
for loose sand), the percentage of readings falling
within the known channel orientation (north to
northeast) increases. A similar result was obtained
by Cameron et al. {1993) in their outcrop simulation