

298
The Stratigraphic Architecture of Fluvial Depositional Systems
I
I
I
OOSERVED
PQARITY
'
� PAT !HAN ri
'0
\
\
\ \
'
0
l
\ a \ POLARITY
\ \ TIME SCALE
NAGRI FM.
j 'IOU:ANtC
lUFF
t:.C.44A
""""'
t
CH!NJI FM.
l
r
KAML!AL/t.ll RREE
'"·
j
'
0
\ I
CHR�\
'
9 \
... __ ,''� ... ...
10
1 4
15
CHR
"'
•oo
ll.l'O
11.79
12.74
13.46
IM
17.�
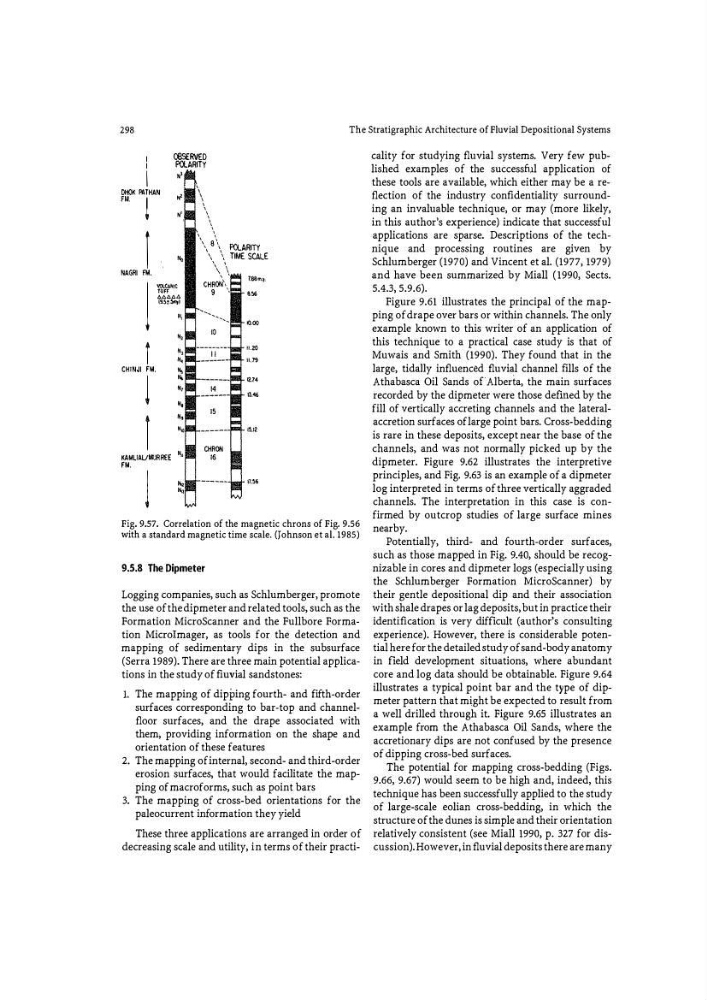
Fig. 9.57. Correlation of the magnetic chrons of Fig. 9.56
with a standard magnetic time scale. (Johnson et al. 1985)
9.5.8 The Dipmeter
Logging companies, such as Schlumberger, promote
the use of the dipmeter and related tools, such as the
Formation MicroScanner and the Fullbore Forma�
tion Microlmager, as tools for the detection and
mapping of sedimentary dips in the subsurface
(Serra 1989). There are three main potential applications in the study of fl uvial sandstones:
J. The mapping of dipping fourth- and fifth-order
surfaces corresponding to bar-top and channelfloor surfaces, and the drape associated with
them, providing inform4tion on the shape and
orientation of these features
2. The mapping of internal, second- and third-order
erosion surfaces, that would facilitate the mapping of macroforms, such as point bars
3. The mapping of cross-bed orientations for the
paleocurrent information they yield
These three applications are arranged in order of
decreasing scale and utility, in terms of their practicality for studying fluvial systems. Very few published examples of the successful application of
these tools are available, which either may be a reflection of the industry confi dentiality surrounding an invaluable technique, or may (more likely,
in this author's experience) indicate that successful
applications are sparse. Descriptions of the technique and processing routines are given by
Schlumberger (1970) and Vincent et al. (1977, 1979)
and have been summarized by Miall (1990, Sects.
5.4.3, 5.9.6).
Figure 9.61 illustrates the principal of the mapping of drape over bars or within channels. The only
example known to this writer of an application of
this technique to a practical case study is that of
Muwais and Smith (1990). They found that in the
large, tidally influenced fluvial channel fills of the
Athabasca Oil Sands of Alberta, the main surfaces
recorded by the dipmeter were those defmed by the
fill of vertically accreting channels and the lateralaccretion surfaces of large point bars. Cross-bedding
is rare in these deposits, except near the base of the
channels, and was not normally picked up by the
dipmeter. Figure 9.62 illustrates the interpretive
principles, and Fig. 9.63 is an example of a dipmeter
log interpreted in terms of three vertically aggraded
channels. The interpretation in this case is confirmed by outcrop studies of large surface mines
nearby.
Potentially, third- and fo urth-order surfaces,
such as those mapped in Fig. 9.40, should be recognizable in cores and dip meter logs (especially using
the Schlumberger Formation MicroScanner) by
their gentle depositional dip and their association
with shale drapes or lag deposits, but in practice their
identifi cation is very difficult (author
, s consulting
experience). However, there is considerable potential here for the detailed study of sand-body anatomy
in field development situations, where abundant
core and log data should be obtainable. Figure 9.64
illustrates a typical point bar and the type of dipmeter pattern that might be expected to result from
a well drilled through it. Figure 9.65 illustrates an
example from the Athabasca Oil Sands, where the
accretionary dips are not confused by the presence
of dipping cross-bed surfaces.
The potential for mapping cross-bedding (Figs.
9.66, 9.67) would seem to be high and, indeed, this
technique has been successfully applied to the study
of large-scale eolian cross-bedding, in which the
structure of the dunes is simple and their orientation
relatively consistent (see Miall 1990, p. 327 for discussion). However, in fluvial deposits there are many
The Stratigraphic Architecture of Fluvial Depositional Systems
I
I
I
OOSERVED
PQARITY
'
� PAT !HAN ri
'0
\
\
\ \
'
0
l
\ a \ POLARITY
\ \ TIME SCALE
NAGRI FM.
j 'IOU:ANtC
lUFF
t:.C.44A
""""'
t
CH!NJI FM.
l
r
KAML!AL/t.ll RREE
'"·
j
'
0
\ I
CHR�\
'
9 \
... __ ,''� ... ...
10
1 4
15
CHR
"'
•oo
ll.l'O
11.79
12.74
13.46
IM
17.�
Fig. 9.57. Correlation of the magnetic chrons of Fig. 9.56
with a standard magnetic time scale. (Johnson et al. 1985)
9.5.8 The Dipmeter
Logging companies, such as Schlumberger, promote
the use of the dipmeter and related tools, such as the
Formation MicroScanner and the Fullbore Forma�
tion Microlmager, as tools for the detection and
mapping of sedimentary dips in the subsurface
(Serra 1989). There are three main potential applications in the study of fl uvial sandstones:
J. The mapping of dipping fourth- and fifth-order
surfaces corresponding to bar-top and channelfloor surfaces, and the drape associated with
them, providing inform4tion on the shape and
orientation of these features
2. The mapping of internal, second- and third-order
erosion surfaces, that would facilitate the mapping of macroforms, such as point bars
3. The mapping of cross-bed orientations for the
paleocurrent information they yield
These three applications are arranged in order of
decreasing scale and utility, in terms of their practicality for studying fluvial systems. Very few published examples of the successful application of
these tools are available, which either may be a reflection of the industry confi dentiality surrounding an invaluable technique, or may (more likely,
in this author's experience) indicate that successful
applications are sparse. Descriptions of the technique and processing routines are given by
Schlumberger (1970) and Vincent et al. (1977, 1979)
and have been summarized by Miall (1990, Sects.
5.4.3, 5.9.6).
Figure 9.61 illustrates the principal of the mapping of drape over bars or within channels. The only
example known to this writer of an application of
this technique to a practical case study is that of
Muwais and Smith (1990). They found that in the
large, tidally influenced fluvial channel fills of the
Athabasca Oil Sands of Alberta, the main surfaces
recorded by the dipmeter were those defmed by the
fill of vertically accreting channels and the lateralaccretion surfaces of large point bars. Cross-bedding
is rare in these deposits, except near the base of the
channels, and was not normally picked up by the
dipmeter. Figure 9.62 illustrates the interpretive
principles, and Fig. 9.63 is an example of a dipmeter
log interpreted in terms of three vertically aggraded
channels. The interpretation in this case is confirmed by outcrop studies of large surface mines
nearby.
Potentially, third- and fo urth-order surfaces,
such as those mapped in Fig. 9.40, should be recognizable in cores and dip meter logs (especially using
the Schlumberger Formation MicroScanner) by
their gentle depositional dip and their association
with shale drapes or lag deposits, but in practice their
identifi cation is very difficult (author
, s consulting
experience). However, there is considerable potential here for the detailed study of sand-body anatomy
in field development situations, where abundant
core and log data should be obtainable. Figure 9.64
illustrates a typical point bar and the type of dipmeter pattern that might be expected to result from
a well drilled through it. Figure 9.65 illustrates an
example from the Athabasca Oil Sands, where the
accretionary dips are not confused by the presence
of dipping cross-bed surfaces.
The potential for mapping cross-bedding (Figs.
9.66, 9.67) would seem to be high and, indeed, this
technique has been successfully applied to the study
of large-scale eolian cross-bedding, in which the
structure of the dunes is simple and their orientation
relatively consistent (see Miall 1990, p. 327 for discussion). However, in fluvial deposits there are many