

296
The Stratigraphic Architecture of Fluvial Depositional Systems
7
•
17
18 19
'
"
5
He
OK
MKM
10
"'
"
aw
"
"
lWD
KAK
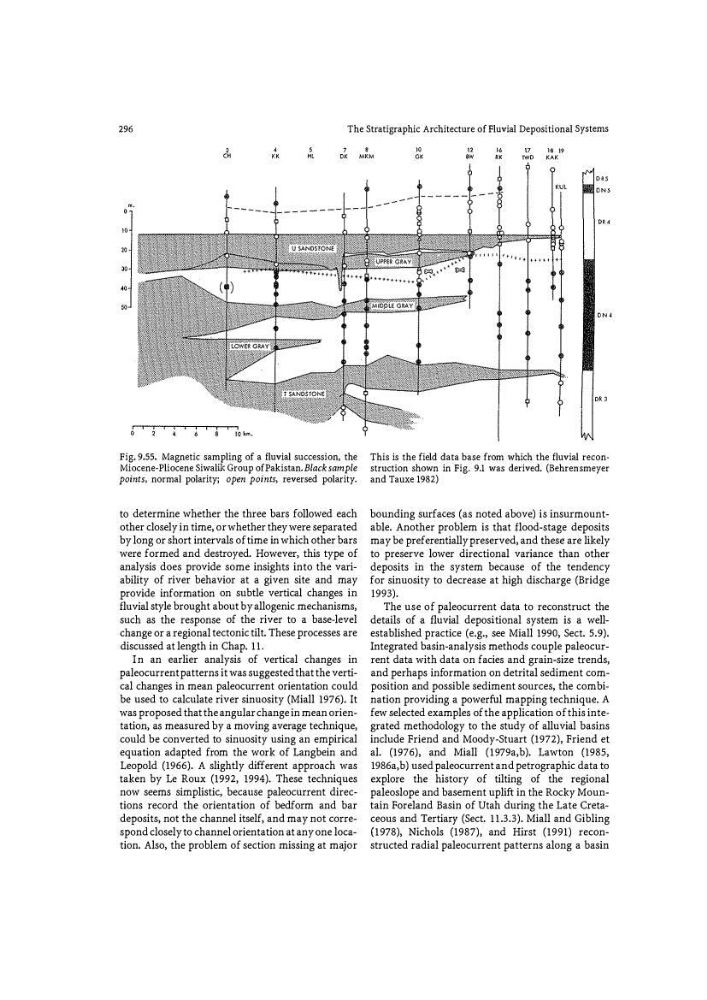
Fig. 9.55. Magnetic sampling of a fluvial succession, the
Miocene� Pliocene Siwalik Group of Pakistan. Black sample
points, normal polarity; open points, reversed polarity.
to determine whether the three bars followed each
other closely in time, or whether they were separated
by long or short intervals of time in which other bars
were formed and destroyed. However, this type of
analysis does provide some insights into the variability of river b€havior at a given site and may
provide information on subtle vertical changes in
fluvial style brought about by allogenic mechanisms,
such as the response of the river to a base-level
change or a regional tectonic tilt. These processes are
discussed at length in Chap. 11.
In an earlier analysis of vertical changes in
paleocurrent patterns it was suggested that the vertical changes in mean paleocurrent orientation could
be used to calculate river sinuosity (Miall 1976). It
was proposed that the angular change in mean orientation, as measured by a moving average technique,
could be converted to sinuosity using an empirical
equation adapted from the work of Langbein and
Leopold (1966). A slightly different approach was
taken by Le Roux (1992, 1994). These techniques
now seems simplistic, because paleocurrent directions record the orientation of bedform and bar
deposits, not the channel itself, and may not correspond closely to channel orientation at any one location. Also, the problem of section missing at major
'"'
'"
DRS
ON5
ON 4
DR 3
This is the field data base from which the fluvial reconstruction shown in Fig. 9.1 was derived. (Behrensmeyer
and Tauxe 1982)
bounding surfaces (as noted above) is insurmountable. Another problem is that flood-stage deposits
may be preferentially preserved, and these are likely
to preserve lower directional variance than other
deposits in the system because of the tendency
for sinuosity to decrease at high discharge (Bridge
1993).
The use of paleocurrent data to reconstruct the
details of a fluvial depositional system is a wellestablished practice (e.g., see Miall 1990, Sect. 5.9).
Integrated basin-analysis methods couple paleocurrent data with data on facies and grain-size trends,
and perhaps information on detrital sediment composition and possible sediment sources, the combination providing a powerful mapping technique. A
few selected examples of the application of this integrated methodology to the study of alluvial basins
include Friend and Moody-Stuart (1972), Friend et
al. (1976), and Miall (1979a,b). Lawton (1985,
1986a,b) used paleocurrent and petrographic data to
explore the history of tilting of the regional
paleoslope and basement uplift in the Rocky Mountain Foreland Basin of Utah during the Late Cretaceous and Tertiary (Sect. 11.3.3). Miall and Gibling
(1978), Nichols (1987), and Hirst (1991) reconstructed radial paleocurrent patterns along a basin
The Stratigraphic Architecture of Fluvial Depositional Systems
7
•
17
18 19
'
"
5
He
OK
MKM
10
"'
"
aw
"
"
lWD
KAK
Fig. 9.55. Magnetic sampling of a fluvial succession, the
Miocene� Pliocene Siwalik Group of Pakistan. Black sample
points, normal polarity; open points, reversed polarity.
to determine whether the three bars followed each
other closely in time, or whether they were separated
by long or short intervals of time in which other bars
were formed and destroyed. However, this type of
analysis does provide some insights into the variability of river b€havior at a given site and may
provide information on subtle vertical changes in
fluvial style brought about by allogenic mechanisms,
such as the response of the river to a base-level
change or a regional tectonic tilt. These processes are
discussed at length in Chap. 11.
In an earlier analysis of vertical changes in
paleocurrent patterns it was suggested that the vertical changes in mean paleocurrent orientation could
be used to calculate river sinuosity (Miall 1976). It
was proposed that the angular change in mean orientation, as measured by a moving average technique,
could be converted to sinuosity using an empirical
equation adapted from the work of Langbein and
Leopold (1966). A slightly different approach was
taken by Le Roux (1992, 1994). These techniques
now seems simplistic, because paleocurrent directions record the orientation of bedform and bar
deposits, not the channel itself, and may not correspond closely to channel orientation at any one location. Also, the problem of section missing at major
'"'
'"
DRS
ON5
ON 4
DR 3
This is the field data base from which the fluvial reconstruction shown in Fig. 9.1 was derived. (Behrensmeyer
and Tauxe 1982)
bounding surfaces (as noted above) is insurmountable. Another problem is that flood-stage deposits
may be preferentially preserved, and these are likely
to preserve lower directional variance than other
deposits in the system because of the tendency
for sinuosity to decrease at high discharge (Bridge
1993).
The use of paleocurrent data to reconstruct the
details of a fluvial depositional system is a wellestablished practice (e.g., see Miall 1990, Sect. 5.9).
Integrated basin-analysis methods couple paleocurrent data with data on facies and grain-size trends,
and perhaps information on detrital sediment composition and possible sediment sources, the combination providing a powerful mapping technique. A
few selected examples of the application of this integrated methodology to the study of alluvial basins
include Friend and Moody-Stuart (1972), Friend et
al. (1976), and Miall (1979a,b). Lawton (1985,
1986a,b) used paleocurrent and petrographic data to
explore the history of tilting of the regional
paleoslope and basement uplift in the Rocky Mountain Foreland Basin of Utah during the Late Cretaceous and Tertiary (Sect. 11.3.3). Miall and Gibling
(1978), Nichols (1987), and Hirst (1991) reconstructed radial paleocurrent patterns along a basin