

278
The Stratigraphic Architecture of Fluvial Depositional Systems
0
10
N
\
Scale
20
30
km
40
50
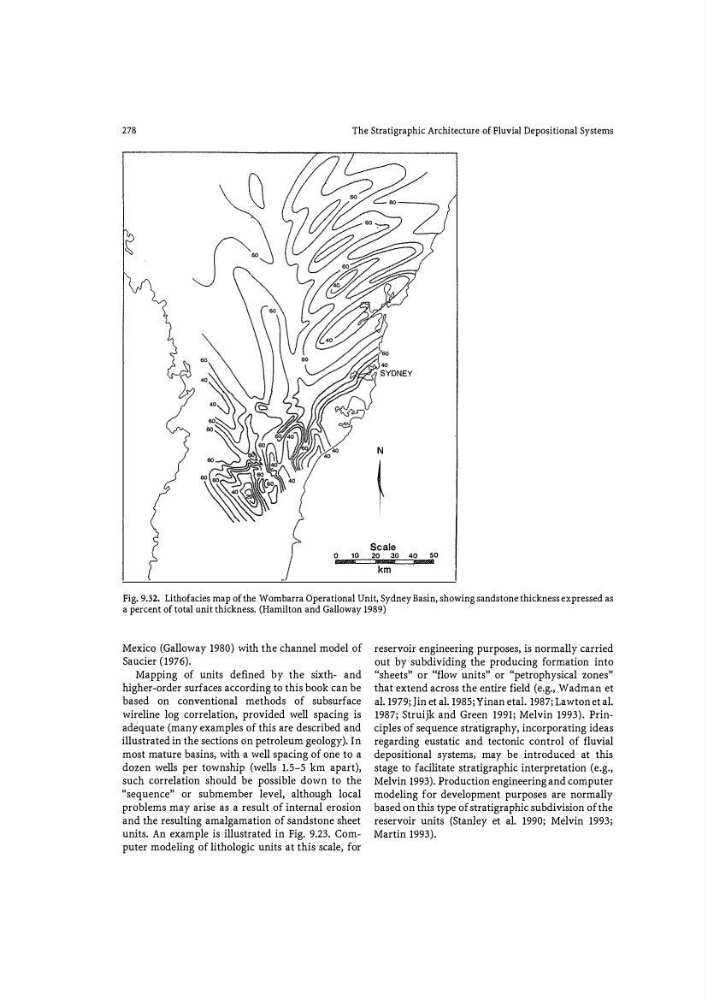
Fig. 9.32. Lithofacies map of the Wombarra Operational Unit, Sydney Basin, showing sandstone thickness expressed as
a percent of total unit thickness. (Hamilton and Galloway 1989)
Mexico (Galloway 1980) with the channel model of
Saucier (1976).
Mapping of units defined by the sixth- and
higher-order surfaces according to this book can be
based on conventional methods of subsurface
wireline log correlation, provided well spacing is
adequate (many examples of this are described and
illustrated in the sections on petroleum geology). In
most mature basins, with a well spacing of one to a
dozen wells per township (wells 1.5-5 km apart),
such correlation should be possible down to the
"sequence" or submember level, although local
problems may arise as a result of internal erosion
and the resulting amalgamation of sandstone sheet
units. An example is illustrated in Fig. 9.23. Computer modeling of lithologic units at this scale1 for
reservoir engineering purposes, is normally carried
out by subdividing the producing fo rmation into
('sheets" or '(flow Units" or ((petrophysical zones"
that extend across the entire field (e.g., Wadman et
al. 1979; )in et al. 1985; Yinan eta!. 1987; Lawton et al.
1987; Struijk and Green 1991; Melvin 1993). Principles of sequence str 3. tigraphy, incorporating ideas
regarding eustatic and tectonic control of fluvial
depositional systems ) may be introduced at this
stage to facilitate stratigraphic interpretation (e.g.,
Melvin 1993). Production engineering and computer
modeling for development purposes are normally
based on this type of stratigraphic subdivision of the
reservoir units (Stanley et al. 1990; Melvin 1993;
Martin 1993).
The Stratigraphic Architecture of Fluvial Depositional Systems
0
10
N
\
Scale
20
30
km
40
50
Fig. 9.32. Lithofacies map of the Wombarra Operational Unit, Sydney Basin, showing sandstone thickness expressed as
a percent of total unit thickness. (Hamilton and Galloway 1989)
Mexico (Galloway 1980) with the channel model of
Saucier (1976).
Mapping of units defined by the sixth- and
higher-order surfaces according to this book can be
based on conventional methods of subsurface
wireline log correlation, provided well spacing is
adequate (many examples of this are described and
illustrated in the sections on petroleum geology). In
most mature basins, with a well spacing of one to a
dozen wells per township (wells 1.5-5 km apart),
such correlation should be possible down to the
"sequence" or submember level, although local
problems may arise as a result of internal erosion
and the resulting amalgamation of sandstone sheet
units. An example is illustrated in Fig. 9.23. Computer modeling of lithologic units at this scale1 for
reservoir engineering purposes, is normally carried
out by subdividing the producing fo rmation into
('sheets" or '(flow Units" or ((petrophysical zones"
that extend across the entire field (e.g., Wadman et
al. 1979; )in et al. 1985; Yinan eta!. 1987; Lawton et al.
1987; Struijk and Green 1991; Melvin 1993). Principles of sequence str 3. tigraphy, incorporating ideas
regarding eustatic and tectonic control of fluvial
depositional systems ) may be introduced at this
stage to facilitate stratigraphic interpretation (e.g.,
Melvin 1993). Production engineering and computer
modeling for development purposes are normally
based on this type of stratigraphic subdivision of the
reservoir units (Stanley et al. 1990; Melvin 1993;
Martin 1993).