

Methods of Correlation and Mapping
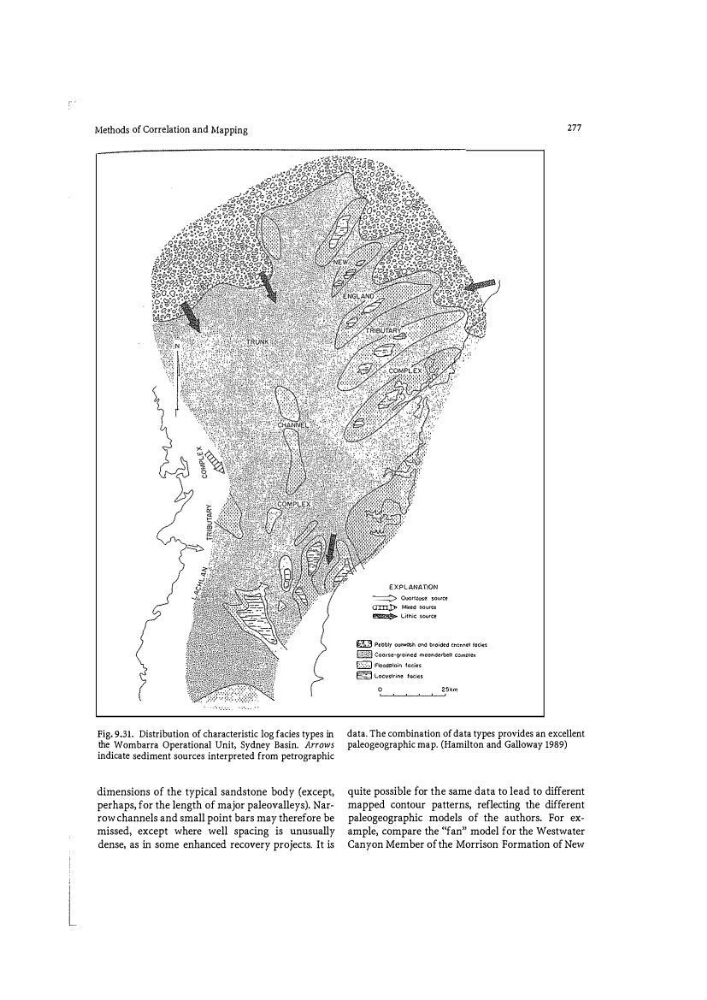
Fig. 9.31. Distribution of characteristic log facies types in
the Wombarra Operational Unit, Sydney Basin. Arrows
indicate sediment sources interpreted from petrographic
dimensions of the typical sandstone body (except,
perhaps, for the length of major paleovalleys). Narrow channels and small point bars may therefore be
missed, except where well spacing is unusually
dense, as in some enhanced recovery projects. It is
EXPLANATION
� QU()f!�0'5e source
cr:r:o:j)> Mixed sour�•
� LithiC SOUfCe
[1.] Pe!>bly outwash a�
§ Locu�trine lo<:ies
277
data. The combination of data types provides an excellent
paleogeographic map. (Hamilton and Galloway 1989)
quite possible for the same data to lead to different
mapped contour patterns, reflecting the different
paleogeographic models of the authors. For example, compare the
Fig. 9.31. Distribution of characteristic log facies types in
the Wombarra Operational Unit, Sydney Basin. Arrows
indicate sediment sources interpreted from petrographic
dimensions of the typical sandstone body (except,
perhaps, for the length of major paleovalleys). Narrow channels and small point bars may therefore be
missed, except where well spacing is unusually
dense, as in some enhanced recovery projects. It is
EXPLANATION
� QU()f!�0'5e source
cr:r:o:j)> Mixed sour�•
� LithiC SOUfCe
[1.] Pe!>bly outwash a�
§ Locu�trine lo<:ies
277
data. The combination of data types provides an excellent
paleogeographic map. (Hamilton and Galloway 1989)
quite possible for the same data to lead to different
mapped contour patterns, reflecting the different
paleogeographic models of the authors. For example, compare the