

Methods of Correlation and Mapping
origins are discussed in Chap. 11. Hanneman et al.
(!994) discussed the subsurface mapping of paleosols and their use for defining sequence boundaries.
Calcic paleosols within clastic fluvial successions are
characterized by their high density and high interval
velocities ) which makes them readily identifiable on
density and sonic logs and in seismic records (Sect.
9.5.4).
The use of sequence-stratigraphic concepts can
considerably aid in regional mapping ) even within
entirely nonmarine successions. For example) the
Statfjord and underlying units in the northern North
Sea can be subdivided into shale-rich and sandstone-rich intervals, the development of which reflects the balance between changing accommodation
space and sediment supply) as described in detail in
Chap. 13. Mapping of these variations and correlation of major internal erosion surfaces interpreted to
be sequence boundaries forms the basis for fieldwide and regional correlation (Steel and Ryseth
!990; MacDonald and Halland !993). Exploration in
275
the mixed marine-nonmarine Latrobe Group of the
Gippsland Basin is now based largely on the sequence-stratigraphic model of Rahmanian et al.
(1990). Melvin (1993) discussed the influence of tectonism on basin development in the Endicott field
area of Alaska.
Ryseth (1989) reported a subsurface study of the
Middle Jurassic Ness Formation in the northern
North Sea Basin. He was able to subdivide this 100m-thick succession into its main architectural components and to correlate them between four
exploration wells over a distance of about 10 km
using a combination of core and wireline-log information. Coals and paleosols defined the tops and
bases of a series of autogenic cycles which could be
traced between wells.
Visher et al. (1971) used log character and shape
to discriminate various fluvial and deltaic environments in the Bartlesville Sandstone of Oklahoma.
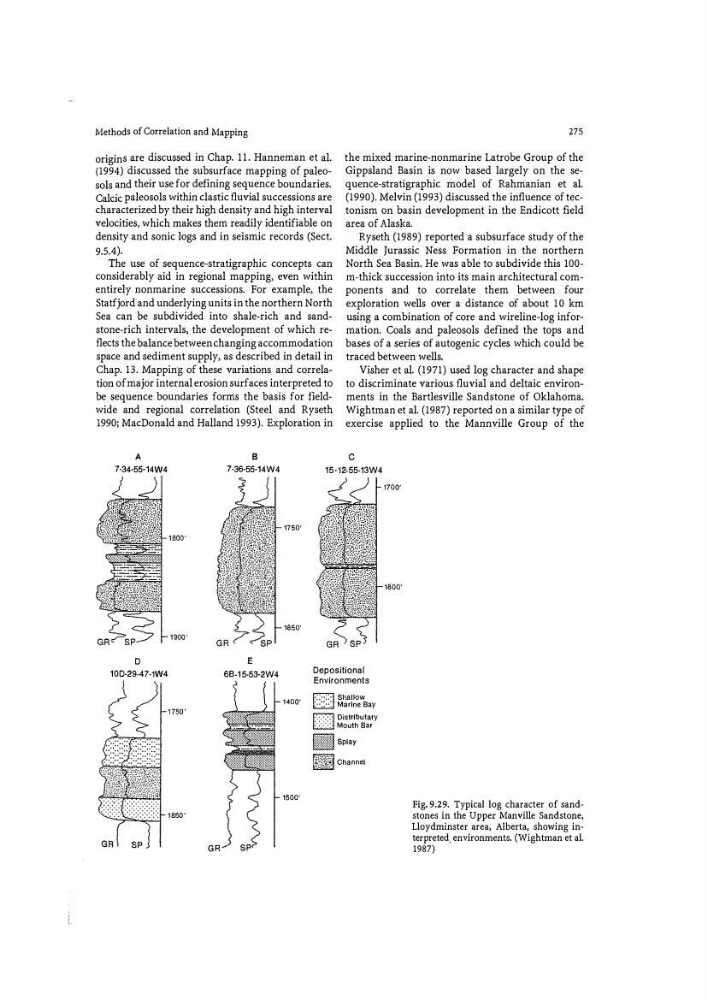
Wightman et al. (1987) reported on a similar type of
exercise applied to the Mannville Group of the
A
7-34·55· 14W4
B
7-36·55·14W4
c
15·12·55·13W4
D
10D·29-47-1W4
GR
E
68-1 5·53·2W4
1750'
1850'
1400'
1500'
Depositional
Environments
� Shallow
L.;,;,::] Marine Bay
� Distributary
l2.:.8] Mouth Bar
M\[ ! j t{l
Splay
[��W;�1 Channel
1700'
1800'
Fig. 9.29. Typical log character of sandstones in the Upper Manville Sandstone,
Lloydminster area, Alberta, showing interpreted. environments. (Wightman et al.
1987)
origins are discussed in Chap. 11. Hanneman et al.
(!994) discussed the subsurface mapping of paleosols and their use for defining sequence boundaries.
Calcic paleosols within clastic fluvial successions are
characterized by their high density and high interval
velocities ) which makes them readily identifiable on
density and sonic logs and in seismic records (Sect.
9.5.4).
The use of sequence-stratigraphic concepts can
considerably aid in regional mapping ) even within
entirely nonmarine successions. For example) the
Statfjord and underlying units in the northern North
Sea can be subdivided into shale-rich and sandstone-rich intervals, the development of which reflects the balance between changing accommodation
space and sediment supply) as described in detail in
Chap. 13. Mapping of these variations and correlation of major internal erosion surfaces interpreted to
be sequence boundaries forms the basis for fieldwide and regional correlation (Steel and Ryseth
!990; MacDonald and Halland !993). Exploration in
275
the mixed marine-nonmarine Latrobe Group of the
Gippsland Basin is now based largely on the sequence-stratigraphic model of Rahmanian et al.
(1990). Melvin (1993) discussed the influence of tectonism on basin development in the Endicott field
area of Alaska.
Ryseth (1989) reported a subsurface study of the
Middle Jurassic Ness Formation in the northern
North Sea Basin. He was able to subdivide this 100m-thick succession into its main architectural components and to correlate them between four
exploration wells over a distance of about 10 km
using a combination of core and wireline-log information. Coals and paleosols defined the tops and
bases of a series of autogenic cycles which could be
traced between wells.
Visher et al. (1971) used log character and shape
to discriminate various fluvial and deltaic environments in the Bartlesville Sandstone of Oklahoma.
Wightman et al. (1987) reported on a similar type of
exercise applied to the Mannville Group of the
A
7-34·55· 14W4
B
7-36·55·14W4
c
15·12·55·13W4
D
10D·29-47-1W4
GR
E
68-1 5·53·2W4
1750'
1850'
1400'
1500'
Depositional
Environments
� Shallow
L.;,;,::] Marine Bay
� Distributary
l2.:.8] Mouth Bar
M\[ ! j t{l
Splay
[��W;�1 Channel
1700'
1800'
Fig. 9.29. Typical log character of sandstones in the Upper Manville Sandstone,
Lloydminster area, Alberta, showing interpreted. environments. (Wightman et al.
1987)