

262
The Stratigraphic Architecture of Fluvial Depositional Systems
A
1--- --_ __; ;;50 mi
80km
B
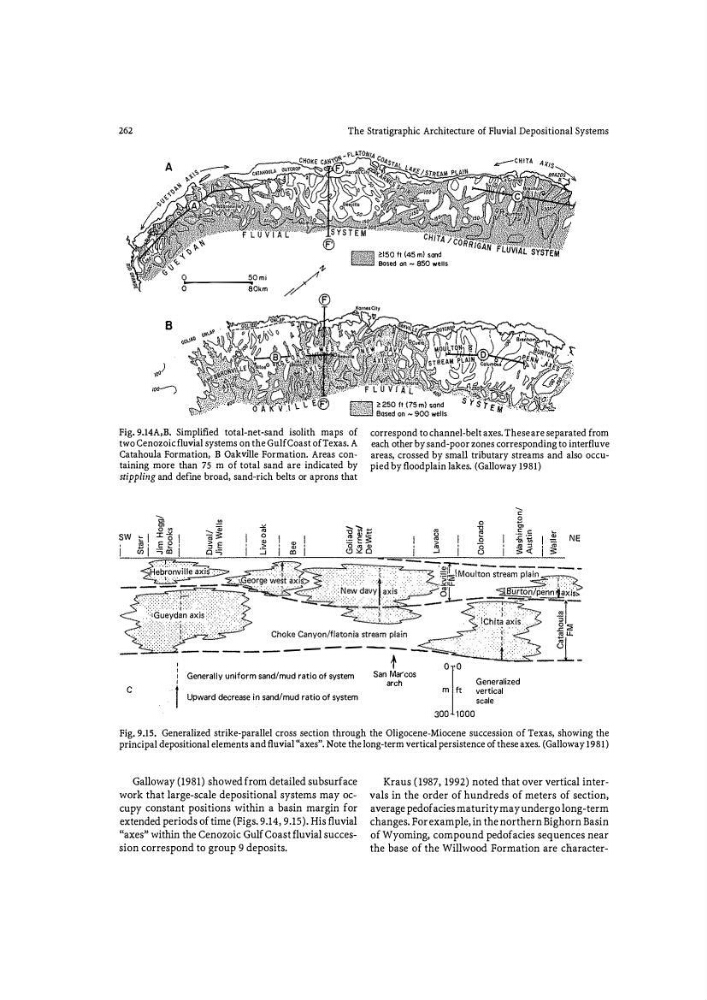
Fig. 9.14A,B. Simplified total-net�sand isolith maps of
tw'o Cenozoic fluvial systems on the Gulf Coast of Texas. A
Catahoula Formation, B Oakville Formation. Areas con�
taining. more than 75 m of total sand are indicated by
stippling and define broad, sand�rich belts or aprons that
�!50 It (45 ml sand
Based on .... . 850 wells
correspond to channel-belt axes. These are separated from
each other by sand-poor zones corresponding to interfluve
areas, crossed by small tributary streams and also occupied by floodplain lakes. (Galloway 1981)
�
0
0
B
�
:g� .�
-o
�
ro
�
0
SW
0
e
:.c· §
.l! NE
=ES:
ro
0
..
,
0
�
o ro •
ro
ro "
0:<
"'"'"
-"
(.)
- - -- - t - � � -... .. ..l
::..:. ..±
San Ma(cos
0
1
°
Generally uniform sand/mud ratio of system
c
Upward decrease in sand/mud ratio of system
arch
Generalized
m ft
vertical
scale
300 1000
Fig. 9.15. Generalized strike-parallel cross section through the Oligocene-Miocene succession of Texas, showing the
principal depositional elements and fluvial "axes". Note the long-term vertical persistence of these axes. (Galloway 1981)
Galloway (1981) showed from detailed subsurface
work that large-scale depositional systems may occupy constant positions within a basin margin for
extended periods of time (Figs. 9.14, 9.15). His fl uvial
''axes" within the Cenozoic Gulf Coast fluvial succession correspond to group 9 deposits.
Kraus (1987, 1992) noted that over vertical intervals in the order of hundreds of meters of section,
average pedofacies maturity may undergo long-term
changes. For example, in the northern Bighorn Basin
of Wyoming, compound pedofacies sequences near
the base of the Willwood Formation are character-
The Stratigraphic Architecture of Fluvial Depositional Systems
A
1--- --_ __; ;;50 mi
80km
B
Fig. 9.14A,B. Simplified total-net�sand isolith maps of
tw'o Cenozoic fluvial systems on the Gulf Coast of Texas. A
Catahoula Formation, B Oakville Formation. Areas con�
taining. more than 75 m of total sand are indicated by
stippling and define broad, sand�rich belts or aprons that
�!50 It (45 ml sand
Based on .... . 850 wells
correspond to channel-belt axes. These are separated from
each other by sand-poor zones corresponding to interfluve
areas, crossed by small tributary streams and also occupied by floodplain lakes. (Galloway 1981)
�
0
0
B
�
:g� .�
-o
�
ro
�
0
SW
0
e
:.c· §
.l! NE
=ES:
ro
0
..
,
0
�
o ro •
ro
ro "
0:<
"'"'"
-"
(.)
- - -- - t - � � -... .. ..l
::..:. ..±
San Ma(cos
0
1
°
Generally uniform sand/mud ratio of system
c
Upward decrease in sand/mud ratio of system
arch
Generalized
m ft
vertical
scale
300 1000
Fig. 9.15. Generalized strike-parallel cross section through the Oligocene-Miocene succession of Texas, showing the
principal depositional elements and fluvial "axes". Note the long-term vertical persistence of these axes. (Galloway 1981)
Galloway (1981) showed from detailed subsurface
work that large-scale depositional systems may occupy constant positions within a basin margin for
extended periods of time (Figs. 9.14, 9.15). His fl uvial
''axes" within the Cenozoic Gulf Coast fluvial succession correspond to group 9 deposits.
Kraus (1987, 1992) noted that over vertical intervals in the order of hundreds of meters of section,
average pedofacies maturity may undergo long-term
changes. For example, in the northern Bighorn Basin
of Wyoming, compound pedofacies sequences near
the base of the Willwood Formation are character-