

Estimating Mature Plays
55
Pool Sizes Conditional on Pool Rank
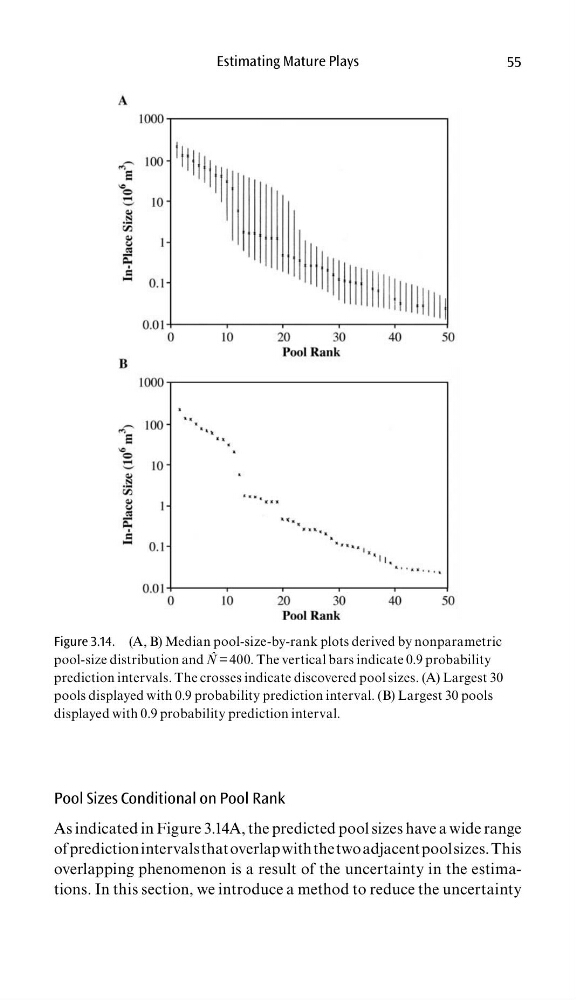
As indicated in Figure 3.14A, the predicted pool sizes have a wide range
of prediction intervals that overlap with the two adjacent pool sizes. This
overlapping phenomenon is a result of the uncertainty in the estimations. In this section, we introduce a method to reduce the uncertainty
Figure 3.14. (A, B) Median pool-size-by-rank plots derived by nonparametric
pool-size distribution and N ˆ = 400. The vertical bars indicate 0.9 probability
prediction intervals. The crosses indicate discovered pool sizes. (A) Largest 30
pools displayed with 0.9 probability prediction interval. (B) Largest 30 pools
displayed with 0.9 probability prediction interval.
55
Pool Sizes Conditional on Pool Rank
As indicated in Figure 3.14A, the predicted pool sizes have a wide range
of prediction intervals that overlap with the two adjacent pool sizes. This
overlapping phenomenon is a result of the uncertainty in the estimations. In this section, we introduce a method to reduce the uncertainty
Figure 3.14. (A, B) Median pool-size-by-rank plots derived by nonparametric
pool-size distribution and N ˆ = 400. The vertical bars indicate 0.9 probability
prediction intervals. The crosses indicate discovered pool sizes. (A) Largest 30
pools displayed with 0.9 probability prediction interval. (B) Largest 30 pools
displayed with 0.9 probability prediction interval.