

56
Statistical Methods for Estimating Petroleum Resources
by including pool rank in the analysis (Lee and Wang, 1985). The sizes
of the undiscovered pools are further constrained by the fact that their
size ranges cannot exceed or be less than any discovered (matched)
pools that are ranked greater or less than the unmatched pool. The
statistical treatment is explained in Appendix D.
Distribution of the Ratio of Two Pools
The distribution of the ratio of two pools can be estimated if the
pool-size and number-of-pools distributions are given (see Appendix
D). Taking the Beaverhill Lake play as an example, the distribution
of the ratio between two pools was estimated and is given in Table 3.4.
The ratio leads us to ask the question: Have we discovered the
largest pool?
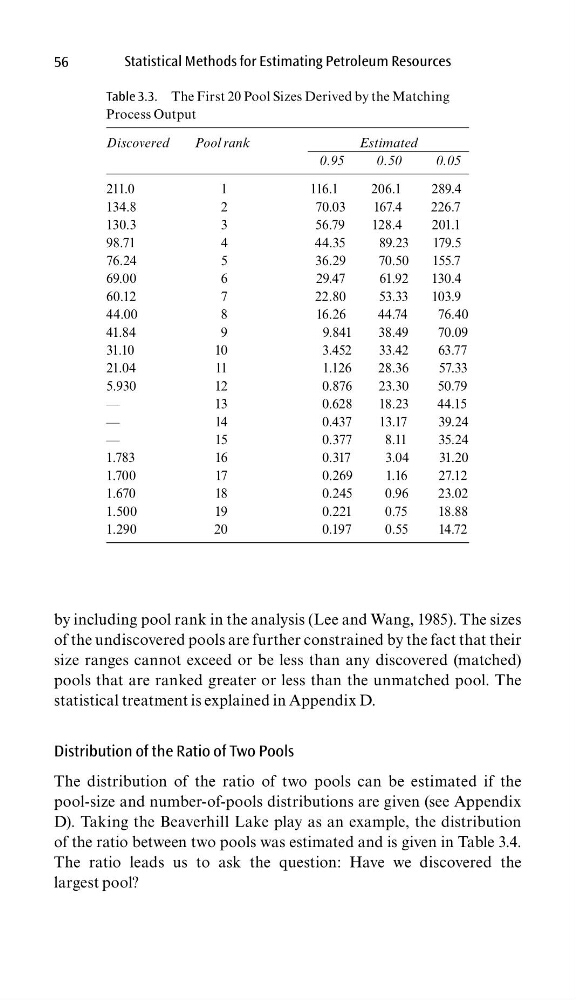
Table 3.3. The First 20 Pool Sizes Derived by the Matching
Process Output
Discovered
Pool rank
Estimated
0.95
0.50
0.05
211.0
1
116.1
206.1
289.4
134.8
2
70.03
167.4
226.7
130.3
3
56.79
128.4
201.1
98.71
4
44.35
89.23
179.5
76.24
5
36.29
70.50
155.7
69.00
6
29.47
61.92
130.4
60.12
7
22.80
53.33
103.9
44.00
8
16.26
44.74
76.40
41.84
9
9.841
38.49
70.09
31.10
10
3.452
33.42
63.77
21.04
11
1.126
28.36
57.33
5.930
12
0.876
23.30
50.79
—
1 3
0 . 6 2 8
1 8 . 2 3
4 4 . 1 5
—
1 4
0 . 4 3 7
1 3 . 1 7
3 9 . 2 4
—
1 5
0 . 3 7 7
8 . 1 1
3 5 . 2 4
1.783
16
0.317
3.04
31.20
1.700
17
0.269
1.16
27.12
1.670
18
0.245
0.96
23.02
1.500
19
0.221
0.75
18.88
1.290
20
0.197
0.55
14.72
Statistical Methods for Estimating Petroleum Resources
by including pool rank in the analysis (Lee and Wang, 1985). The sizes
of the undiscovered pools are further constrained by the fact that their
size ranges cannot exceed or be less than any discovered (matched)
pools that are ranked greater or less than the unmatched pool. The
statistical treatment is explained in Appendix D.
Distribution of the Ratio of Two Pools
The distribution of the ratio of two pools can be estimated if the
pool-size and number-of-pools distributions are given (see Appendix
D). Taking the Beaverhill Lake play as an example, the distribution
of the ratio between two pools was estimated and is given in Table 3.4.
The ratio leads us to ask the question: Have we discovered the
largest pool?
Table 3.3. The First 20 Pool Sizes Derived by the Matching
Process Output
Discovered
Pool rank
Estimated
0.95
0.50
0.05
211.0
1
116.1
206.1
289.4
134.8
2
70.03
167.4
226.7
130.3
3
56.79
128.4
201.1
98.71
4
44.35
89.23
179.5
76.24
5
36.29
70.50
155.7
69.00
6
29.47
61.92
130.4
60.12
7
22.80
53.33
103.9
44.00
8
16.26
44.74
76.40
41.84
9
9.841
38.49
70.09
31.10
10
3.452
33.42
63.77
21.04
11
1.126
28.36
57.33
5.930
12
0.876
23.30
50.79
—
1 3
0 . 6 2 8
1 8 . 2 3
4 4 . 1 5
—
1 4
0 . 4 3 7
1 3 . 1 7
3 9 . 2 4
—
1 5
0 . 3 7 7
8 . 1 1
3 5 . 2 4
1.783
16
0.317
3.04
31.20
1.700
17
0.269
1.16
27.12
1.670
18
0.245
0.96
23.02
1.500
19
0.221
0.75
18.88
1.290
20
0.197
0.55
14.72