

Evaluating Conceptual Plays
131
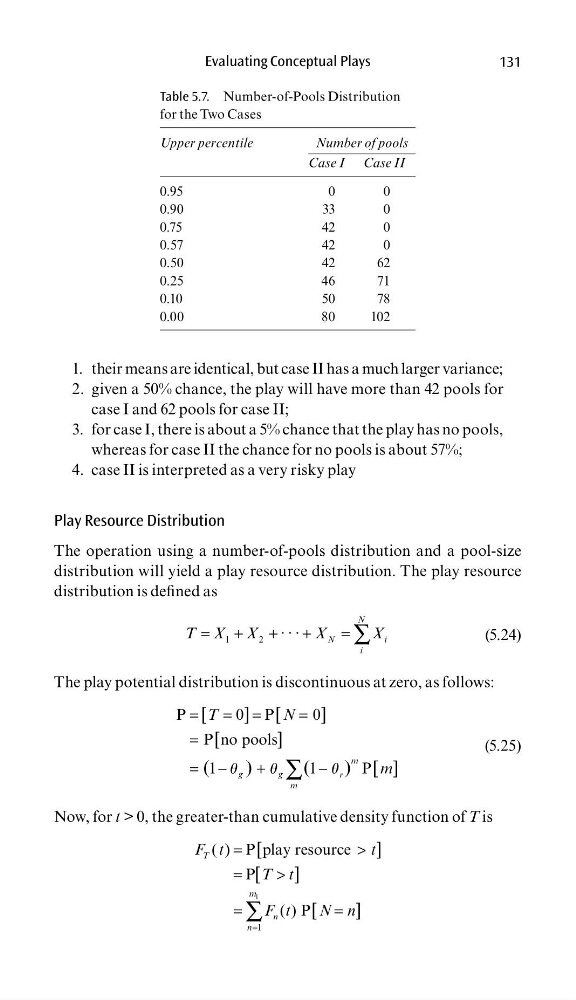
their means are identical, but case II has a much larger variance;
1.
given a 50% chance, the play will have more than 42 pools for
2.
case I and 62 pools for case II;
for case I, there is about a 5% chance that the play has no pools,
3.
whereas for case II the chance for no pools is about 57%;
case II is interpreted as a very risky play
4.
Play Resource Distribution
The operation using a number-of-pools distribution and a pool-size
distribution will yield a play resource distribution. The play resource
distribution is defi ned as
=
+
+
+
= ∑
1
2
· · ·
N
N
i
i
T X X
X
X
(5.24)
The play potential distribution is discontinuous at zero, as follows:
P
0 P
0
P no pools
1
1
P
[
] [
]
[
]
(
)
(
) [ ]
m
g
g
r
m
T
N
m
=
= =
=
=
= −
+
−
∑
u
u
u
(5.25)
Now, for t > 0, the greater-than cumulative density function of T is
1
1
( ) P play resource
P
( ) P
[
]
[
]
[
]
T
m
n
n
F t
t
T t
F t
N n
=
=
>
=
>
=
=
∑
Table 5.7. Number-of-Pools Distribution
for the Two Cases
Upper percentile
Number of pools
Case I Case II
0.95
0
0
0.90
33
0
0.75
42
0
0.57
42
0
0.50
42
62
0.25
46
71
0.10
50
78
0.00
80
102
131
their means are identical, but case II has a much larger variance;
1.
given a 50% chance, the play will have more than 42 pools for
2.
case I and 62 pools for case II;
for case I, there is about a 5% chance that the play has no pools,
3.
whereas for case II the chance for no pools is about 57%;
case II is interpreted as a very risky play
4.
Play Resource Distribution
The operation using a number-of-pools distribution and a pool-size
distribution will yield a play resource distribution. The play resource
distribution is defi ned as
=
+
+
+
= ∑
1
2
· · ·
N
N
i
i
T X X
X
X
(5.24)
The play potential distribution is discontinuous at zero, as follows:
P
0 P
0
P no pools
1
1
P
[
] [
]
[
]
(
)
(
) [ ]
m
g
g
r
m
T
N
m
=
= =
=
=
= −
+
−
∑
u
u
u
(5.25)
Now, for t > 0, the greater-than cumulative density function of T is
1
1
( ) P play resource
P
( ) P
[
]
[
]
[
]
T
m
n
n
F t
t
T t
F t
N n
=
=
>
=
>
=
=
∑
Table 5.7. Number-of-Pools Distribution
for the Two Cases
Upper percentile
Number of pools
Case I Case II
0.95
0
0
0.90
33
0
0.75
42
0
0.57
42
0
0.50
42
62
0.25
46
71
0.10
50
78
0.00
80
102