

Evaluating Conceptual Plays
123
The preceding examples demonstrated the impact of correlation
on the mean of a pool-size distribution when the sample covariance
matrix had been computed and used. The population covariance
matrix should be computed using MDSCV (see Chapter 3).
1
1
10
100
1000
A
B
10
0.01
10
20
30
40
50
60
70
80
90
100
0.1
1
POOL SIZE, 10
6 m
3
10
100
1000
100
1000
POOL AREA, ha
AVERAGE NET PAY, m
CUMULATIVE FREQUENCY
GREATER THAN, %
10000
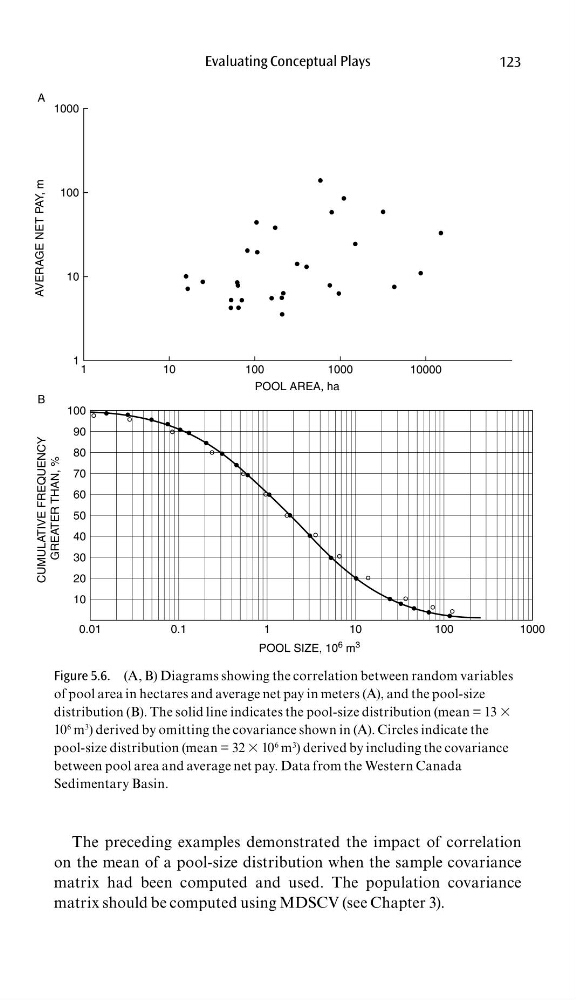
Figure 5.6. (A, B) Diagrams showing the correlation between random variables
of pool area in hectares and average net pay in meters (A), and the pool-size
distribution (B). The solid line indicates the pool-size distribution (mean = 13 ×
10
6 m
3
) derived by omitting the covariance shown in (A). Circles indicate the
pool-size distribution (mean = 32 × 10
6 m
3
) derived by including the covariance
between pool area and average net pay. Data from the Western Canada
Sedimentary Basin.
123
The preceding examples demonstrated the impact of correlation
on the mean of a pool-size distribution when the sample covariance
matrix had been computed and used. The population covariance
matrix should be computed using MDSCV (see Chapter 3).
1
1
10
100
1000
A
B
10
0.01
10
20
30
40
50
60
70
80
90
100
0.1
1
POOL SIZE, 10
6 m
3
10
100
1000
100
1000
POOL AREA, ha
AVERAGE NET PAY, m
CUMULATIVE FREQUENCY
GREATER THAN, %
10000
Figure 5.6. (A, B) Diagrams showing the correlation between random variables
of pool area in hectares and average net pay in meters (A), and the pool-size
distribution (B). The solid line indicates the pool-size distribution (mean = 13 ×
10
6 m
3
) derived by omitting the covariance shown in (A). Circles indicate the
pool-size distribution (mean = 32 × 10
6 m
3
) derived by including the covariance
between pool area and average net pay. Data from the Western Canada
Sedimentary Basin.