

122
Statistical Methods for Estimating Petroleum Resources
addition or subtraction of the variance from the pool-size distribution.
If a lognormal distribution were adopted, the variance and covariance
could be adjusted. The Beaverhill Lake play was used to describe the
roles of Equations 5.11 and 5.12 in the pool-size equation.
Figure 5.6A displays the positive correlation between the random
variables of pool area and average net pay. Figure 5.6B demonstrates
the impact of the covariance to the pool-size distribution. The solid line
of Figure 5.6B shows the pool-size distribution derived by omitting the
covariance, whereas the circles show the pool-size distribution derived
by including the covariance. The former distribution has a mean of
13 × 10
6 m
3 and the latter has a mean of 32 × 10
6 m
3
. The difference is
more than double.
Figure 5.7 demonstrates the impact of negative covariance on the
pool size. The solid line shows the pool-size distribution derived by
omitting the negative covariance between the pool area and average
net pay, whereas the circles show the pool-size distribution derived by
including the covariance. The difference of the two means is more than
double.
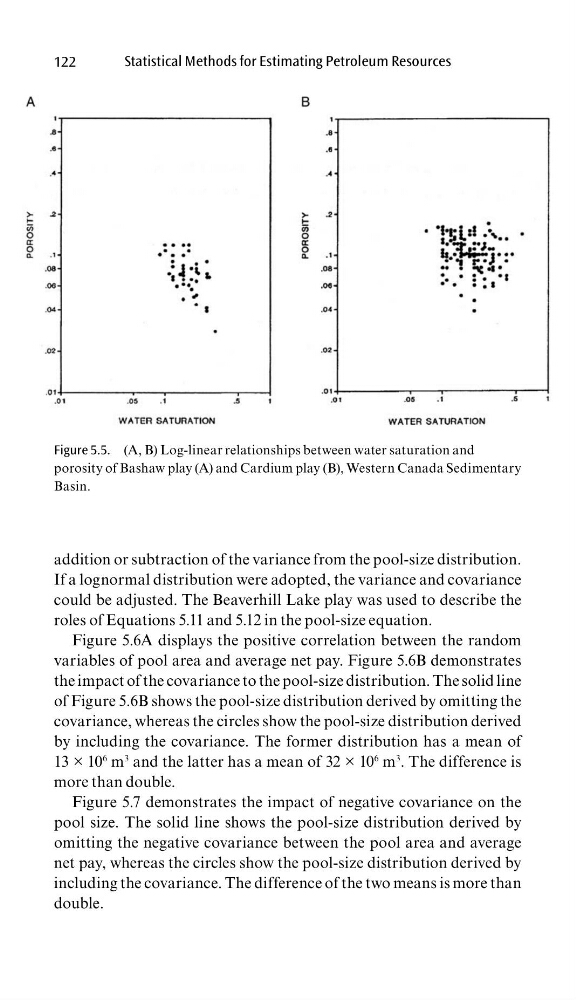
Figure 5.5. (A, B) Log-linear relationships between water saturation and
porosity of Bashaw play (A) and Cardium play (B), Western Canada Sedimentary
Basin.
Statistical Methods for Estimating Petroleum Resources
addition or subtraction of the variance from the pool-size distribution.
If a lognormal distribution were adopted, the variance and covariance
could be adjusted. The Beaverhill Lake play was used to describe the
roles of Equations 5.11 and 5.12 in the pool-size equation.
Figure 5.6A displays the positive correlation between the random
variables of pool area and average net pay. Figure 5.6B demonstrates
the impact of the covariance to the pool-size distribution. The solid line
of Figure 5.6B shows the pool-size distribution derived by omitting the
covariance, whereas the circles show the pool-size distribution derived
by including the covariance. The former distribution has a mean of
13 × 10
6 m
3 and the latter has a mean of 32 × 10
6 m
3
. The difference is
more than double.
Figure 5.7 demonstrates the impact of negative covariance on the
pool size. The solid line shows the pool-size distribution derived by
omitting the negative covariance between the pool area and average
net pay, whereas the circles show the pool-size distribution derived by
including the covariance. The difference of the two means is more than
double.
Figure 5.5. (A, B) Log-linear relationships between water saturation and
porosity of Bashaw play (A) and Cardium play (B), Western Canada Sedimentary
Basin.