

124
Statistical Methods for Estimating Petroleum Resources
The East Coast Play
One play from the East Coast of Canada was selected to illustrate the
application of PETRIMES in a conceptual play. The data used include
probability distributions of area of closure, reservoir thickness, porosity, and trap fi ll. The equation used to calculate pool-size distribution
is as follows:
Pool Size = c × Area of Closure ×
Reservoir Thickness × Porosity × Trap Fill
(5.14)
where c is the product of hydrocarbon saturation and a conversion factor of cubic feet to millions of barrels. Pool size is oil-in-place measured
in MMbbls.
The probability distributions for reservoir thickness, porosity, and
trap fi ll are considered as superpopulation distributions. The distribution of the area of closure, for example, was derived from structural
contour maps based on seismic data. The distribution proposed by
geologists was plotted as a solid line in Figure 5.8, and was approximated by a lognormal distribution (indicated by open circles).
1
10
20
30
40
50
60
70
80
90
100
10
100
1000
POOL SIZE, 10 6 m 3
CUMULATIVE FREQUENCY
GREATER THAN, %
10000
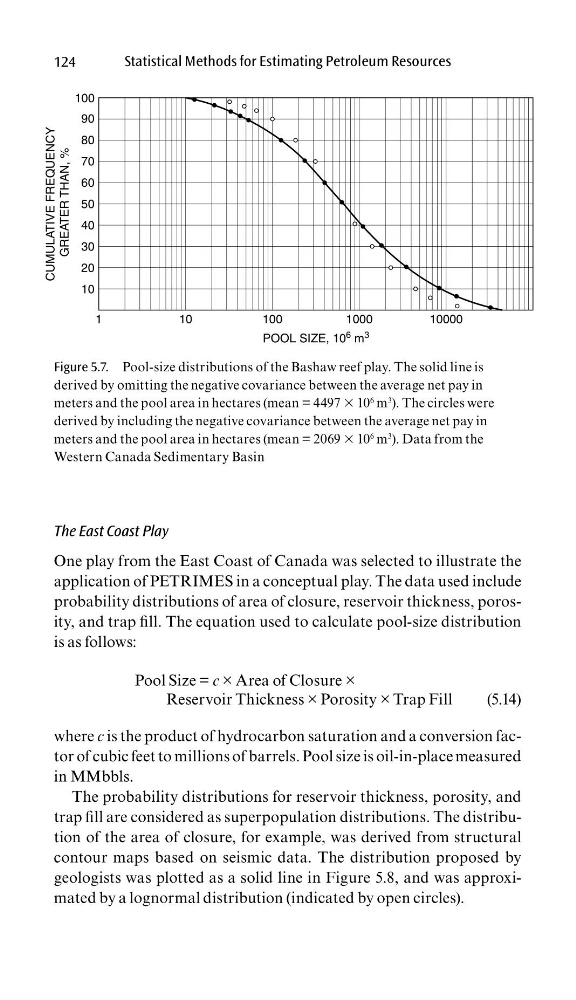
Figure 5.7. Pool-size distributions of the Bashaw reef play. The solid line is
derived by omitting the negative covariance between the average net pay in
meters and the pool area in hectares (mean = 4497 × 10
6 m
3
). The circles were
derived by including the negative covariance between the average net pay in
meters and the pool area in hectares (mean = 2069 × 10
6 m
3
). Data from the
Western Canada Sedimentary Basin
Statistical Methods for Estimating Petroleum Resources
The East Coast Play
One play from the East Coast of Canada was selected to illustrate the
application of PETRIMES in a conceptual play. The data used include
probability distributions of area of closure, reservoir thickness, porosity, and trap fi ll. The equation used to calculate pool-size distribution
is as follows:
Pool Size = c × Area of Closure ×
Reservoir Thickness × Porosity × Trap Fill
(5.14)
where c is the product of hydrocarbon saturation and a conversion factor of cubic feet to millions of barrels. Pool size is oil-in-place measured
in MMbbls.
The probability distributions for reservoir thickness, porosity, and
trap fi ll are considered as superpopulation distributions. The distribution of the area of closure, for example, was derived from structural
contour maps based on seismic data. The distribution proposed by
geologists was plotted as a solid line in Figure 5.8, and was approximated by a lognormal distribution (indicated by open circles).
1
10
20
30
40
50
60
70
80
90
100
10
100
1000
POOL SIZE, 10 6 m 3
CUMULATIVE FREQUENCY
GREATER THAN, %
10000
Figure 5.7. Pool-size distributions of the Bashaw reef play. The solid line is
derived by omitting the negative covariance between the average net pay in
meters and the pool area in hectares (mean = 4497 × 10
6 m
3
). The circles were
derived by including the negative covariance between the average net pay in
meters and the pool area in hectares (mean = 2069 × 10
6 m
3
). Data from the
Western Canada Sedimentary Basin