

80
Statistical Methods for Estimating Petroleum Resources
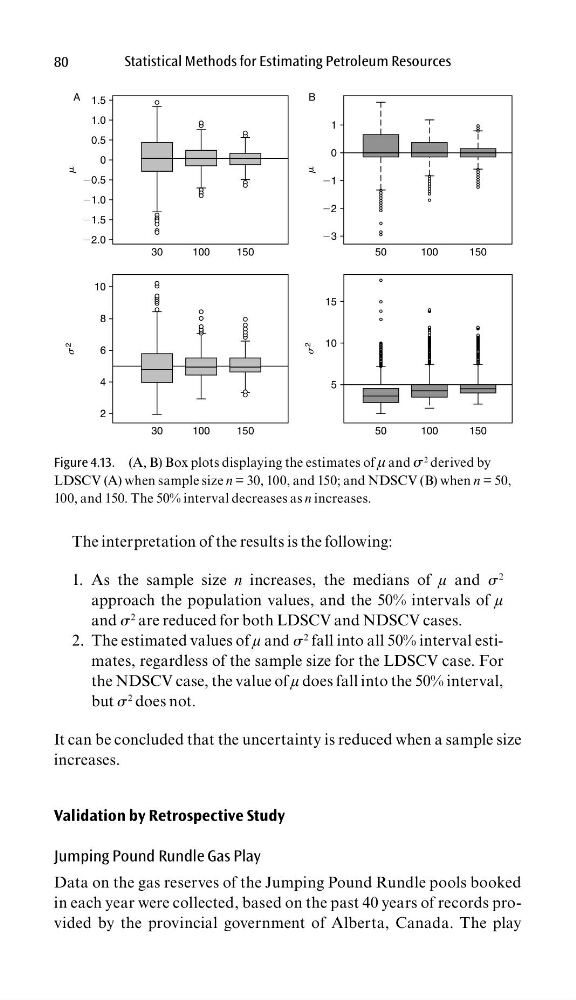
The interpretation of the results is the following:
As the sample size
1.
n increases, the medians of µ and σ
2
approach the population values, and the 50% intervals of µ
and σ
2 are reduced for both LDSCV and NDSCV cases.
The estimated values of
2.
µ and σ
2 fall into all 50% interval estimates, regardless of the sample size for the LDSCV case. For
the NDSCV case, the value of µ does fall into the 50% interval,
but σ
2 does not.
It can be concluded that the uncertainty is reduced when a sample size
increases.
Validation by Retrospective Study
Jumping Pound Rundle Gas Play
Data on the gas reserves of the Jumping Pound Rundle pools booked
in each year were collected, based on the past 40 years of records provided by the provincial government of Alberta, Canada. The play
30
Ϫ2.0
2
4
6
8
10
Ϫ1.5
Ϫ1.0
Ϫ0.5
0
m
s 2
0.5
1.0
1.5
A
B
Ϫ3
Ϫ2
Ϫ1
0
1
m
5
10
15
s 2
100
150
30
100
150
50
100
150
50
100
150
Figure 4.13. (A, B) Box plots displaying the estimates of µ and σ
2 derived by
LDSCV (A) when sample size n = 30, 100, and 150; and NDSCV (B) when n = 50,
100, and 150. The 50% interval decreases as n increases.
Statistical Methods for Estimating Petroleum Resources
The interpretation of the results is the following:
As the sample size
1.
n increases, the medians of µ and σ
2
approach the population values, and the 50% intervals of µ
and σ
2 are reduced for both LDSCV and NDSCV cases.
The estimated values of
2.
µ and σ
2 fall into all 50% interval estimates, regardless of the sample size for the LDSCV case. For
the NDSCV case, the value of µ does fall into the 50% interval,
but σ
2 does not.
It can be concluded that the uncertainty is reduced when a sample size
increases.
Validation by Retrospective Study
Jumping Pound Rundle Gas Play
Data on the gas reserves of the Jumping Pound Rundle pools booked
in each year were collected, based on the past 40 years of records provided by the provincial government of Alberta, Canada. The play
30
Ϫ2.0
2
4
6
8
10
Ϫ1.5
Ϫ1.0
Ϫ0.5
0
m
s 2
0.5
1.0
1.5
A
B
Ϫ3
Ϫ2
Ϫ1
0
1
m
5
10
15
s 2
100
150
30
100
150
50
100
150
50
100
150
Figure 4.13. (A, B) Box plots displaying the estimates of µ and σ
2 derived by
LDSCV (A) when sample size n = 30, 100, and 150; and NDSCV (B) when n = 50,
100, and 150. The 50% interval decreases as n increases.