

More about Discovery Process Models
79
The 1000 pairs of estimated
5.
µ and σ
2 were plotted as box plots
(Fig. 4.13). In these box plots, (a) the horizontal bar indicates
the median value, (b) the box indicates the 50% intervals, and
(c) the vertical bars represent the three standard deviations.
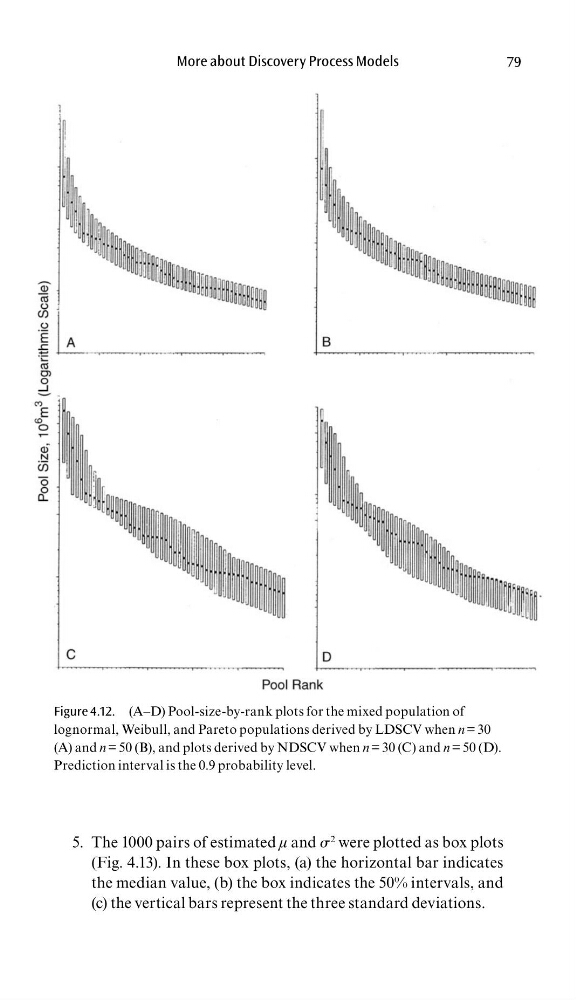
Figure 4.12. (A–D) Pool-size-by-rank plots for the mixed population of
lognormal, Weibull, and Pareto populations derived by LDSCV when n = 30
(A) and n = 50 (B), and plots derived by NDSCV when n = 30 (C) and n = 50 (D).
Prediction interval is the 0.9 probability level.
79
The 1000 pairs of estimated
5.
µ and σ
2 were plotted as box plots
(Fig. 4.13). In these box plots, (a) the horizontal bar indicates
the median value, (b) the box indicates the 50% intervals, and
(c) the vertical bars represent the three standard deviations.
Figure 4.12. (A–D) Pool-size-by-rank plots for the mixed population of
lognormal, Weibull, and Pareto populations derived by LDSCV when n = 30
(A) and n = 50 (B), and plots derived by NDSCV when n = 30 (C) and n = 50 (D).
Prediction interval is the 0.9 probability level.