

78
Statistical Methods for Estimating Petroleum Resources
A discovery process was simulated with a sample of size
2.
n (30,
50, 100, and 150) with β = 0.6.
Samples obtained from these simulations were analyzed using
3.
LDSCV and NDSCV.
Steps 1 through 3 were repeated 1000 times, so 1000 pairs of
4.
estimated µ and σ
2 were obtained.
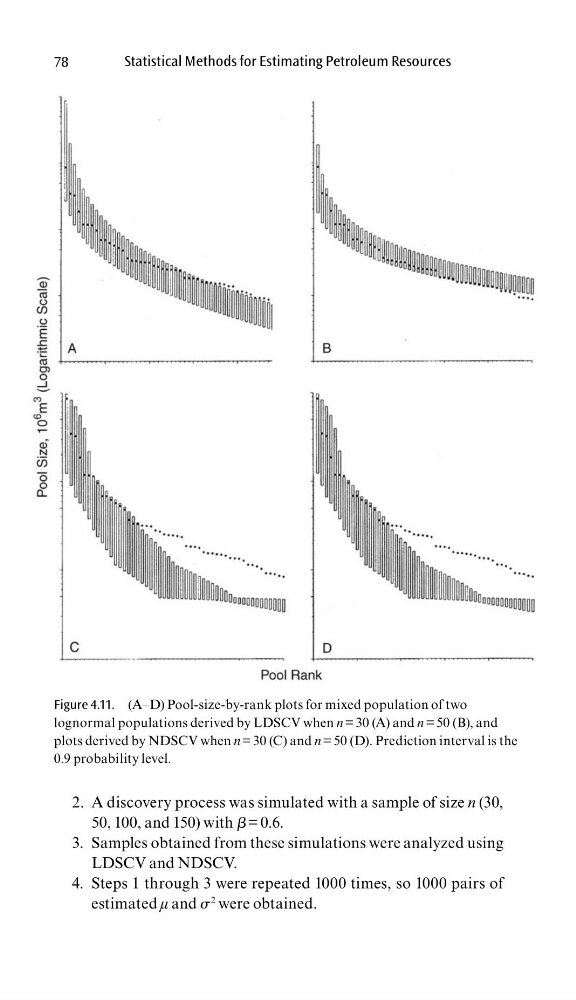
Figure 4.11. (A–D) Pool-size-by-rank plots for mixed population of two
lognormal populations derived by LDSCV when n = 30 (A) and n = 50 (B), and
plots derived by NDSCV when n = 30 (C) and n = 50 (D). Prediction interval is the
0.9 probability level.
Statistical Methods for Estimating Petroleum Resources
A discovery process was simulated with a sample of size
2.
n (30,
50, 100, and 150) with β = 0.6.
Samples obtained from these simulations were analyzed using
3.
LDSCV and NDSCV.
Steps 1 through 3 were repeated 1000 times, so 1000 pairs of
4.
estimated µ and σ
2 were obtained.
Figure 4.11. (A–D) Pool-size-by-rank plots for mixed population of two
lognormal populations derived by LDSCV when n = 30 (A) and n = 50 (B), and
plots derived by NDSCV when n = 30 (C) and n = 50 (D). Prediction interval is the
0.9 probability level.