

158
Z. Tang et al.
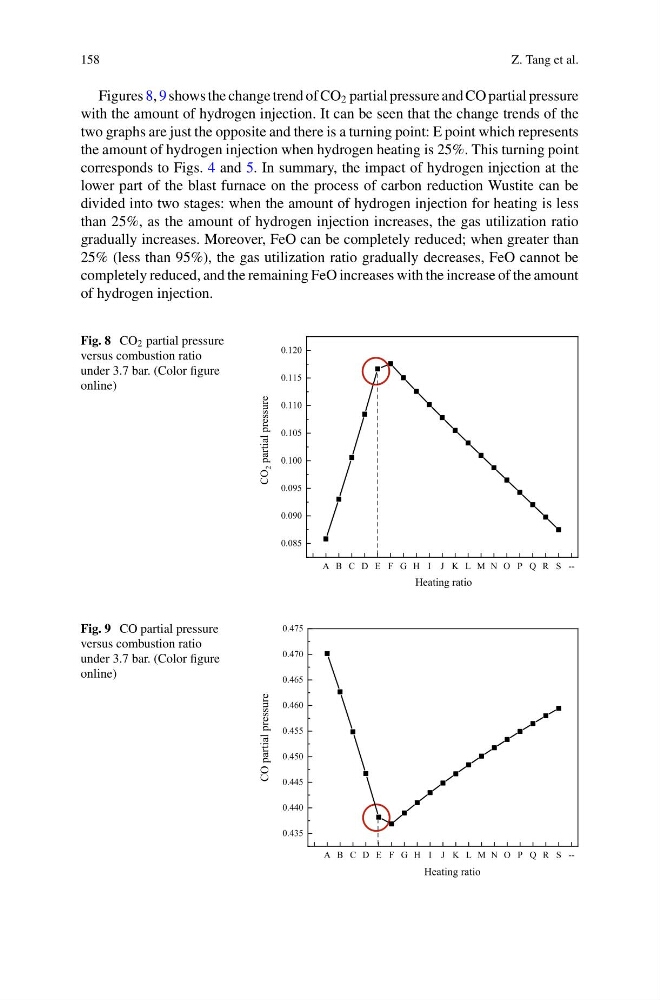
Figures 8, 9 shows the change trend of CO 2 partial pressure and CO partial pressure
with the amount of hydrogen injection. It can be seen that the change trends of the
two graphs are just the opposite and there is a turning point: E point which represents
the amount of hydrogen injection when hydrogen heating is 25%. This turning point
corresponds to Figs. 4 and 5. In summary, the impact of hydrogen injection at the
lower part of the blast furnace on the process of carbon reduction Wustite can be
divided into two stages: when the amount of hydrogen injection for heating is less
than 25%, as the amount of hydrogen injection increases, the gas utilization ratio
gradually increases. Moreover, FeO can be completely reduced; when greater than
25% (less than 95%), the gas utilization ratio gradually decreases, FeO cannot be
completely reduced, and the remaining FeO increases with the increase of the amount
of hydrogen injection.
Fig. 8 CO 2 partial pressure
versus combustion ratio
under 3.7 bar. (Color figure
online)
A B C D E F G H I J K L M N O P Q R S -0.085
0.090
0.095
0.100
0.105
0.110
0.115
0.120
CO
2 partial pressure
Heating ratio
Fig. 9 CO partial pressure
versus combustion ratio
under 3.7 bar. (Color figure
online)
A B C D E F G H I J K L M N O P Q R S -0.435
0.440
0.445
0.450
0.455
0.460
0.465
0.470
0.475
CO partial pressure
Heating ratio
Z. Tang et al.
Figures 8, 9 shows the change trend of CO 2 partial pressure and CO partial pressure
with the amount of hydrogen injection. It can be seen that the change trends of the
two graphs are just the opposite and there is a turning point: E point which represents
the amount of hydrogen injection when hydrogen heating is 25%. This turning point
corresponds to Figs. 4 and 5. In summary, the impact of hydrogen injection at the
lower part of the blast furnace on the process of carbon reduction Wustite can be
divided into two stages: when the amount of hydrogen injection for heating is less
than 25%, as the amount of hydrogen injection increases, the gas utilization ratio
gradually increases. Moreover, FeO can be completely reduced; when greater than
25% (less than 95%), the gas utilization ratio gradually decreases, FeO cannot be
completely reduced, and the remaining FeO increases with the increase of the amount
of hydrogen injection.
Fig. 8 CO 2 partial pressure
versus combustion ratio
under 3.7 bar. (Color figure
online)
A B C D E F G H I J K L M N O P Q R S -0.085
0.090
0.095
0.100
0.105
0.110
0.115
0.120
CO
2 partial pressure
Heating ratio
Fig. 9 CO partial pressure
versus combustion ratio
under 3.7 bar. (Color figure
online)
A B C D E F G H I J K L M N O P Q R S -0.435
0.440
0.445
0.450
0.455
0.460
0.465
0.470
0.475
CO partial pressure
Heating ratio