

Physical Simulation of Bubble Behaviors and Optimization …
141
(a) 400r/min
(b) 500r/min
(c) 600r/min
(d) 700r/min
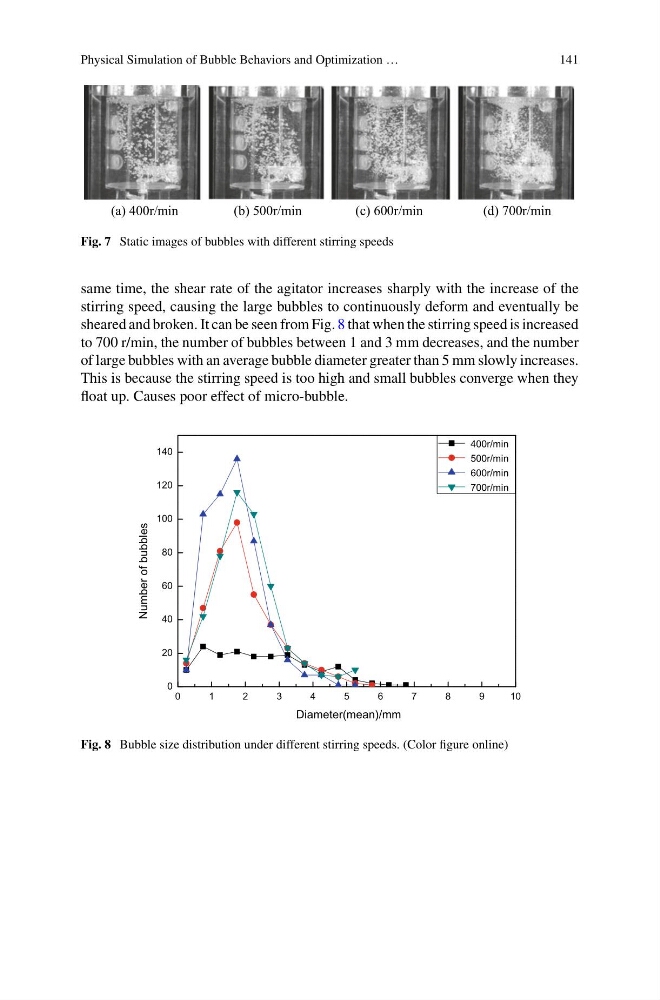
Fig. 7 Static images of bubbles with different stirring speeds
same time, the shear rate of the agitator increases sharply with the increase of the
stirring speed, causing the large bubbles to continuously deform and eventually be
sheared and broken. It can be seen from Fig. 8 that when the stirring speed is increased
to 700 r/min, the number of bubbles between 1 and 3 mm decreases, and the number
of large bubbles with an average bubble diameter greater than 5 mm slowly increases.
This is because the stirring speed is too high and small bubbles converge when they
float up. Causes poor effect of micro-bubble.
0
1
2
3
4
5
6
7
8
9
1 0
0
20
40
60
80
100
120
140
Number of bubbles
Diameter(mean)/mm
400r/min
500r/min
600r/min
700r/min
Fig. 8 Bubble size distribution under different stirring speeds. (Color figure online)
141
(a) 400r/min
(b) 500r/min
(c) 600r/min
(d) 700r/min
Fig. 7 Static images of bubbles with different stirring speeds
same time, the shear rate of the agitator increases sharply with the increase of the
stirring speed, causing the large bubbles to continuously deform and eventually be
sheared and broken. It can be seen from Fig. 8 that when the stirring speed is increased
to 700 r/min, the number of bubbles between 1 and 3 mm decreases, and the number
of large bubbles with an average bubble diameter greater than 5 mm slowly increases.
This is because the stirring speed is too high and small bubbles converge when they
float up. Causes poor effect of micro-bubble.
0
1
2
3
4
5
6
7
8
9
1 0
0
20
40
60
80
100
120
140
Number of bubbles
Diameter(mean)/mm
400r/min
500r/min
600r/min
700r/min
Fig. 8 Bubble size distribution under different stirring speeds. (Color figure online)