

Reduction Behaviors of Hematite to Metallic Iron …
117
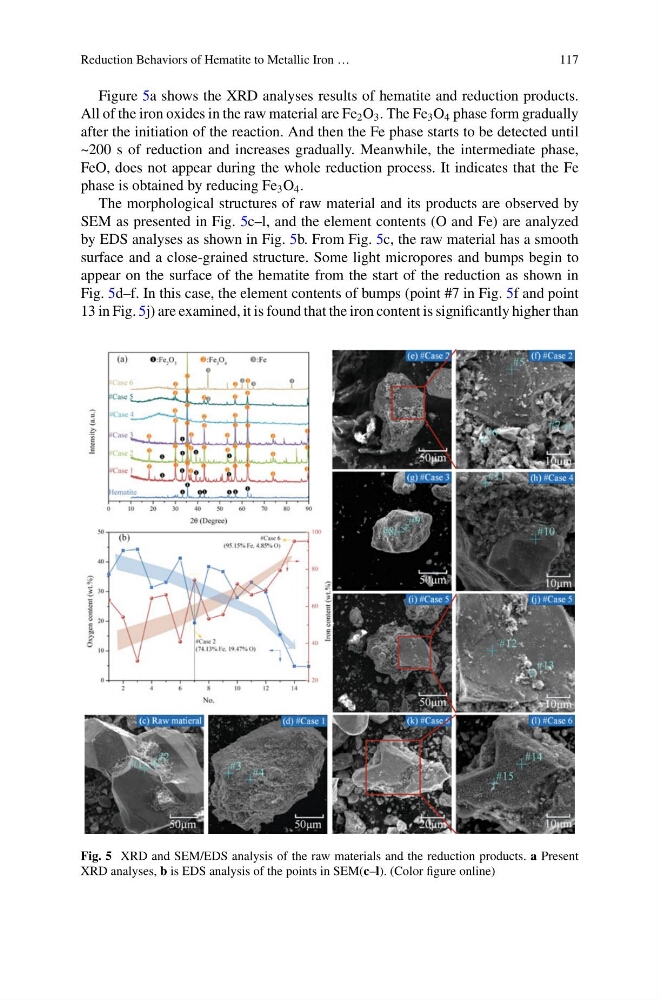
Figure 5a shows the XRD analyses results of hematite and reduction products.
All of the iron oxides in the raw material are Fe 2 O 3 . The Fe 3 O 4 phase form gradually
after the initiation of the reaction. And then the Fe phase starts to be detected until
~200 s of reduction and increases gradually. Meanwhile, the intermediate phase,
FeO, does not appear during the whole reduction process. It indicates that the Fe
phase is obtained by reducing Fe 3 O 4 .
The morphological structures of raw material and its products are observed by
SEM as presented in Fig. 5c–l, and the element contents (O and Fe) are analyzed
by EDS analyses as shown in Fig. 5b. From Fig. 5c, the raw material has a smooth
surface and a close-grained structure. Some light micropores and bumps begin to
appear on the surface of the hematite from the start of the reduction as shown in
Fig. 5d–f. In this case, the element contents of bumps (point #7 in Fig. 5f and point
13 in Fig. 5j) are examined, it is found that the iron content is significantly higher than
Fig. 5 XRD and SEM/EDS analysis of the raw materials and the reduction products. a Present
XRD analyses, b is EDS analysis of the points in SEM(c–l). (Color figure online)
117
Figure 5a shows the XRD analyses results of hematite and reduction products.
All of the iron oxides in the raw material are Fe 2 O 3 . The Fe 3 O 4 phase form gradually
after the initiation of the reaction. And then the Fe phase starts to be detected until
~200 s of reduction and increases gradually. Meanwhile, the intermediate phase,
FeO, does not appear during the whole reduction process. It indicates that the Fe
phase is obtained by reducing Fe 3 O 4 .
The morphological structures of raw material and its products are observed by
SEM as presented in Fig. 5c–l, and the element contents (O and Fe) are analyzed
by EDS analyses as shown in Fig. 5b. From Fig. 5c, the raw material has a smooth
surface and a close-grained structure. Some light micropores and bumps begin to
appear on the surface of the hematite from the start of the reduction as shown in
Fig. 5d–f. In this case, the element contents of bumps (point #7 in Fig. 5f and point
13 in Fig. 5j) are examined, it is found that the iron content is significantly higher than
Fig. 5 XRD and SEM/EDS analysis of the raw materials and the reduction products. a Present
XRD analyses, b is EDS analysis of the points in SEM(c–l). (Color figure online)