

116
K. He et al.
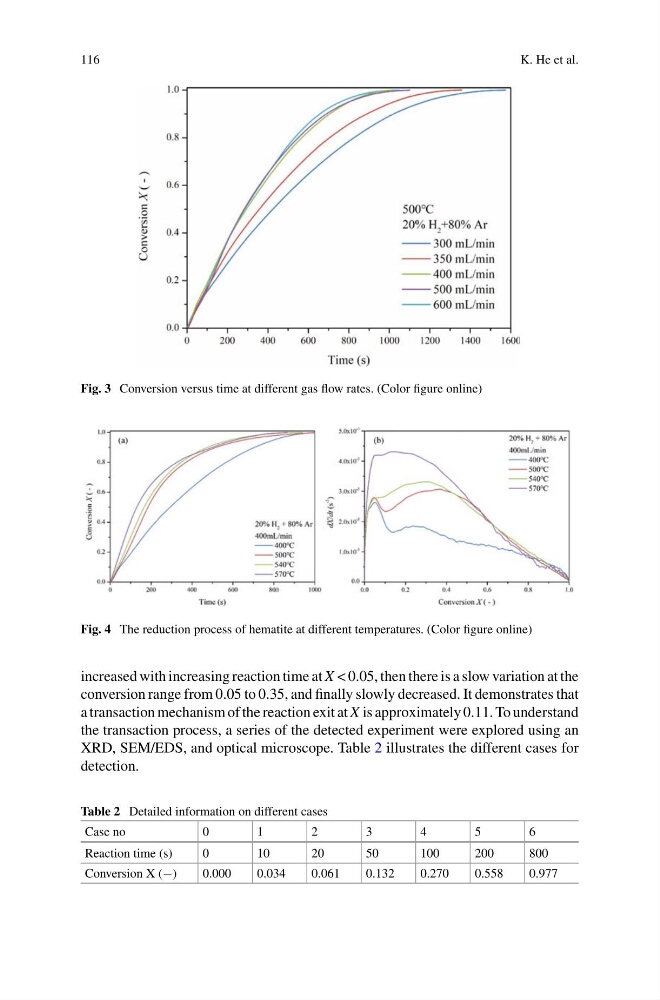
Fig. 3 Conversion versus time at different gas flow rates. (Color figure online)
Fig. 4 The reduction process of hematite at different temperatures. (Color figure online)
increased with increasing reaction time at X < 0.05, then there is a slow variation at the
conversion range from 0.05 to 0.35, and finally slowly decreased. It demonstrates that
a transaction mechanism of the reaction exit at X is approximately 0.11. To understand
the transaction process, a series of the detected experiment were explored using an
XRD, SEM/EDS, and optical microscope. Table 2 illustrates the different cases for
detection.
Table 2 Detailed information on different cases
Case no
0
1
2
3
4
5
6
Reaction time (s)
0
10
20
50
100
200
800
Conversion X (−)
0.000
0.034
0.061
0.132
0.270
0.558
0.977
K. He et al.
Fig. 3 Conversion versus time at different gas flow rates. (Color figure online)
Fig. 4 The reduction process of hematite at different temperatures. (Color figure online)
increased with increasing reaction time at X < 0.05, then there is a slow variation at the
conversion range from 0.05 to 0.35, and finally slowly decreased. It demonstrates that
a transaction mechanism of the reaction exit at X is approximately 0.11. To understand
the transaction process, a series of the detected experiment were explored using an
XRD, SEM/EDS, and optical microscope. Table 2 illustrates the different cases for
detection.
Table 2 Detailed information on different cases
Case no
0
1
2
3
4
5
6
Reaction time (s)
0
10
20
50
100
200
800
Conversion X (−)
0.000
0.034
0.061
0.132
0.270
0.558
0.977