

118
K. He et al.
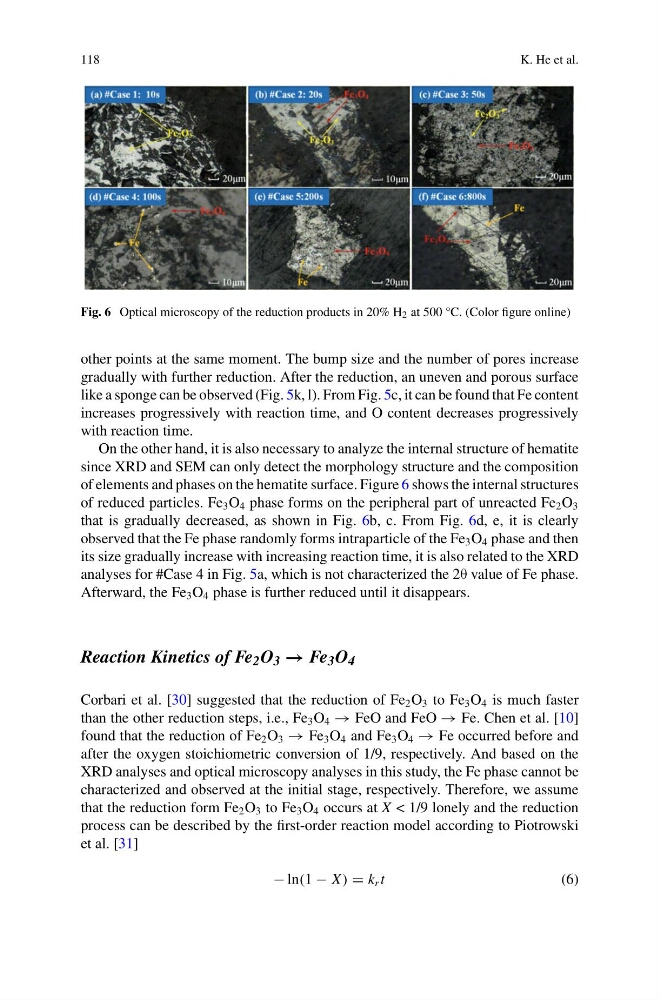
Fig. 6 Optical microscopy of the reduction products in 20% H 2 at 500 °C. (Color figure online)
other points at the same moment. The bump size and the number of pores increase
gradually with further reduction. After the reduction, an uneven and porous surface
like a sponge can be observed (Fig. 5k, l). From Fig. 5c, it can be found that Fe content
increases progressively with reaction time, and O content decreases progressively
with reaction time.
On the other hand, it is also necessary to analyze the internal structure of hematite
since XRD and SEM can only detect the morphology structure and the composition
of elements and phases on the hematite surface. Figure 6 shows the internal structures
of reduced particles. Fe 3 O 4 phase forms on the peripheral part of unreacted Fe 2 O 3
that is gradually decreased, as shown in Fig. 6b, c. From Fig. 6d, e, it is clearly
observed that the Fe phase randomly forms intraparticle of the Fe 3 O 4 phase and then
its size gradually increase with increasing reaction time, it is also related to the XRD
analyses for #Case 4 in Fig. 5a, which is not characterized the 2θ value of Fe phase.
Afterward, the Fe 3 O 4 phase is further reduced until it disappears.
Reaction Kinetics of Fe 2 O 3 → Fe 3 O 4
Corbari et al. [30] suggested that the reduction of Fe 2 O 3 to Fe 3 O 4 is much faster
than the other reduction steps, i.e., Fe 3 O 4 → FeO and FeO → Fe. Chen et al. [10]
found that the reduction of Fe 2 O 3 → Fe 3 O 4 and Fe 3 O 4 → Fe occurred before and
after the oxygen stoichiometric conversion of 1/9, respectively. And based on the
XRD analyses and optical microscopy analyses in this study, the Fe phase cannot be
characterized and observed at the initial stage, respectively. Therefore, we assume
that the reduction form Fe 2 O 3 to Fe 3 O 4 occurs at X < 1/9 lonely and the reduction
process can be described by the first-order reaction model according to Piotrowski
et al. [31]
− ln(1 − X ) = k r t
(6)
K. He et al.
Fig. 6 Optical microscopy of the reduction products in 20% H 2 at 500 °C. (Color figure online)
other points at the same moment. The bump size and the number of pores increase
gradually with further reduction. After the reduction, an uneven and porous surface
like a sponge can be observed (Fig. 5k, l). From Fig. 5c, it can be found that Fe content
increases progressively with reaction time, and O content decreases progressively
with reaction time.
On the other hand, it is also necessary to analyze the internal structure of hematite
since XRD and SEM can only detect the morphology structure and the composition
of elements and phases on the hematite surface. Figure 6 shows the internal structures
of reduced particles. Fe 3 O 4 phase forms on the peripheral part of unreacted Fe 2 O 3
that is gradually decreased, as shown in Fig. 6b, c. From Fig. 6d, e, it is clearly
observed that the Fe phase randomly forms intraparticle of the Fe 3 O 4 phase and then
its size gradually increase with increasing reaction time, it is also related to the XRD
analyses for #Case 4 in Fig. 5a, which is not characterized the 2θ value of Fe phase.
Afterward, the Fe 3 O 4 phase is further reduced until it disappears.
Reaction Kinetics of Fe 2 O 3 → Fe 3 O 4
Corbari et al. [30] suggested that the reduction of Fe 2 O 3 to Fe 3 O 4 is much faster
than the other reduction steps, i.e., Fe 3 O 4 → FeO and FeO → Fe. Chen et al. [10]
found that the reduction of Fe 2 O 3 → Fe 3 O 4 and Fe 3 O 4 → Fe occurred before and
after the oxygen stoichiometric conversion of 1/9, respectively. And based on the
XRD analyses and optical microscopy analyses in this study, the Fe phase cannot be
characterized and observed at the initial stage, respectively. Therefore, we assume
that the reduction form Fe 2 O 3 to Fe 3 O 4 occurs at X < 1/9 lonely and the reduction
process can be described by the first-order reaction model according to Piotrowski
et al. [31]
− ln(1 − X ) = k r t
(6)