

82
5 Empirical Research for Establishing the Potential of Renewable Hydrogen …
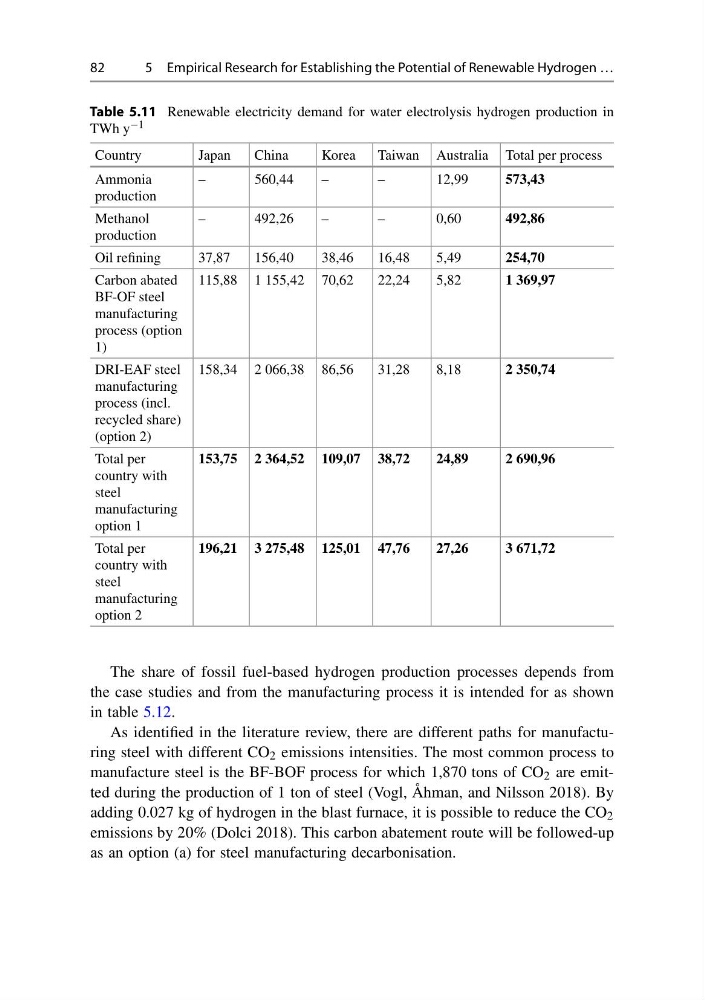
Table 5.11 Renewable electricity demand for water electrolysis hydrogen production in
TWh y −1
Country
Japan
China
Korea
Taiwan Australia Total per process
Ammonia
production
–
560,44
–
–
12,99
573,43
Methanol
production
–
492,26
–
–
0,60
492,86
Oil refining
37,87
156,40
38,46
16,48
5,49
254,70
Carbon abated
BF-OF steel
manufacturing
process (option
1)
115,88 1 155,42 70,62
22,24
5,82
1 369,97
DRI-EAF steel
manufacturing
process (incl.
recycled share)
(option 2)
158,34 2 066,38 86,56
31,28
8,18
2 350,74
Total per
country with
steel
manufacturing
option 1
153,75 2 364,52 109,07 38,72
24,89
2 690,96
Total per
country with
steel
manufacturing
option 2
196,21 3 275,48 125,01 47,76
27,26
3 671,72
The share of fossil fuel-based hydrogen production processes depends from
the case studies and from the manufacturing process it is intended for as shown
in table 5.12.
As identified in the literature review, there are different paths for manufacturing steel with different CO 2 emissions intensities. The most common process to
manufacture steel is the BF-BOF process for which 1,870 tons of CO 2 are emitted during the production of 1 ton of steel (Vogl, Åhman, and Nilsson 2018). By
adding 0.027 kg of hydrogen in the blast furnace, it is possible to reduce the CO 2
emissions by 20% (Dolci 2018). This carbon abatement route will be followed-up
as an option (a) for steel manufacturing decarbonisation.
5 Empirical Research for Establishing the Potential of Renewable Hydrogen …
Table 5.11 Renewable electricity demand for water electrolysis hydrogen production in
TWh y −1
Country
Japan
China
Korea
Taiwan Australia Total per process
Ammonia
production
–
560,44
–
–
12,99
573,43
Methanol
production
–
492,26
–
–
0,60
492,86
Oil refining
37,87
156,40
38,46
16,48
5,49
254,70
Carbon abated
BF-OF steel
manufacturing
process (option
1)
115,88 1 155,42 70,62
22,24
5,82
1 369,97
DRI-EAF steel
manufacturing
process (incl.
recycled share)
(option 2)
158,34 2 066,38 86,56
31,28
8,18
2 350,74
Total per
country with
steel
manufacturing
option 1
153,75 2 364,52 109,07 38,72
24,89
2 690,96
Total per
country with
steel
manufacturing
option 2
196,21 3 275,48 125,01 47,76
27,26
3 671,72
The share of fossil fuel-based hydrogen production processes depends from
the case studies and from the manufacturing process it is intended for as shown
in table 5.12.
As identified in the literature review, there are different paths for manufacturing steel with different CO 2 emissions intensities. The most common process to
manufacture steel is the BF-BOF process for which 1,870 tons of CO 2 are emitted during the production of 1 ton of steel (Vogl, Åhman, and Nilsson 2018). By
adding 0.027 kg of hydrogen in the blast furnace, it is possible to reduce the CO 2
emissions by 20% (Dolci 2018). This carbon abatement route will be followed-up
as an option (a) for steel manufacturing decarbonisation.