

78
5 Empirical Research for Establishing the Potential of Renewable Hydrogen …
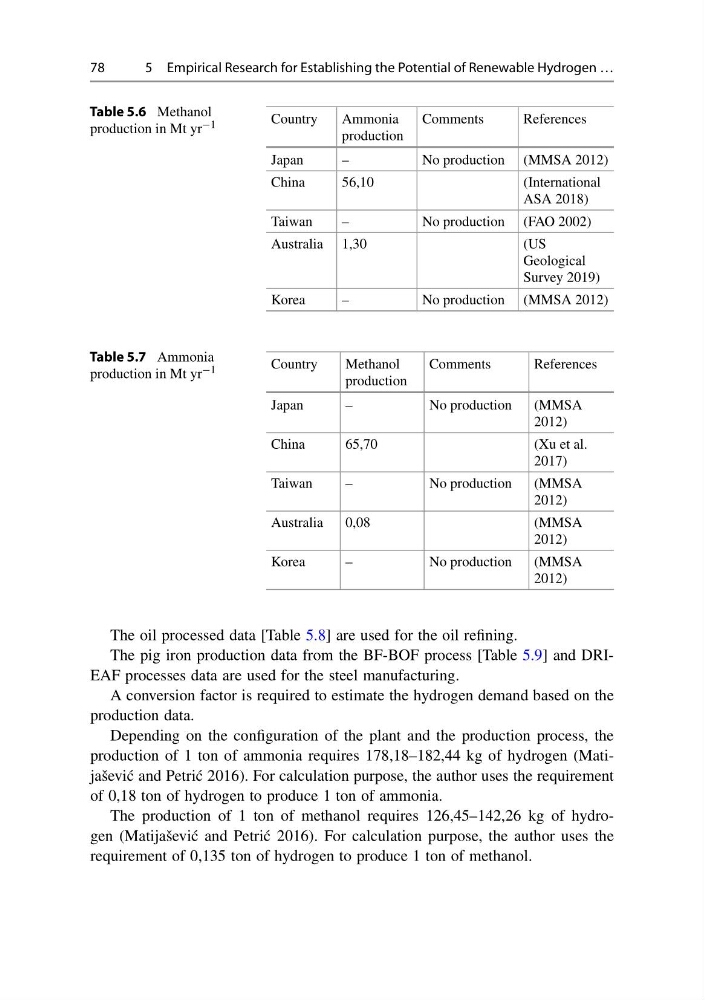
Table 5.6 Methanol
production in Mt yr −1
Country
Ammonia
production
Comments
References
Japan
–
No production (MMSA 2012)
China
56,10
(International
ASA 2018)
Taiwan
–
No production (FAO 2002)
Australia 1,30
(US
Geological
Survey 2019)
Korea
–
No production (MMSA 2012)
Table 5.7 Ammonia
production in Mt yr −1
Country
Methanol
production
Comments
References
Japan
–
No production
(MMSA
2012)
China
65,70
(Xu et al.
2017)
Taiwan
–
No production
(MMSA
2012)
Australia
0,08
(MMSA
2012)
Korea
–
No production
(MMSA
2012)
The oil processed data [Table 5.8] are used for the oil refining.
The pig iron production data from the BF-BOF process [Table 5.9] and DRIEAF processes data are used for the steel manufacturing.
A conversion factor is required to estimate the hydrogen demand based on the
production data.
Depending on the configuration of the plant and the production process, the
production of 1 ton of ammonia requires 178,18–182,44 kg of hydrogen (Matijaševi´ c and Petri´ c 2016). For calculation purpose, the author uses the requirement
of 0,18 ton of hydrogen to produce 1 ton of ammonia.
The production of 1 ton of methanol requires 126,45–142,26 kg of hydrogen (Matijaševi´ c and Petri´ c 2016). For calculation purpose, the author uses the
requirement of 0,135 ton of hydrogen to produce 1 ton of methanol.
5 Empirical Research for Establishing the Potential of Renewable Hydrogen …
Table 5.6 Methanol
production in Mt yr −1
Country
Ammonia
production
Comments
References
Japan
–
No production (MMSA 2012)
China
56,10
(International
ASA 2018)
Taiwan
–
No production (FAO 2002)
Australia 1,30
(US
Geological
Survey 2019)
Korea
–
No production (MMSA 2012)
Table 5.7 Ammonia
production in Mt yr −1
Country
Methanol
production
Comments
References
Japan
–
No production
(MMSA
2012)
China
65,70
(Xu et al.
2017)
Taiwan
–
No production
(MMSA
2012)
Australia
0,08
(MMSA
2012)
Korea
–
No production
(MMSA
2012)
The oil processed data [Table 5.8] are used for the oil refining.
The pig iron production data from the BF-BOF process [Table 5.9] and DRIEAF processes data are used for the steel manufacturing.
A conversion factor is required to estimate the hydrogen demand based on the
production data.
Depending on the configuration of the plant and the production process, the
production of 1 ton of ammonia requires 178,18–182,44 kg of hydrogen (Matijaševi´ c and Petri´ c 2016). For calculation purpose, the author uses the requirement
of 0,18 ton of hydrogen to produce 1 ton of ammonia.
The production of 1 ton of methanol requires 126,45–142,26 kg of hydrogen (Matijaševi´ c and Petri´ c 2016). For calculation purpose, the author uses the
requirement of 0,135 ton of hydrogen to produce 1 ton of methanol.