

5.3 Case Studies for Determining the Potential of Renewable Hydrogen …
79
Table 5.8 Oil processed in
refineries in Mt yr −1
Country
Oil processed in
refineries
References
Japan
153,21
(UNSD — Energy
Statistics n.d.)
China
632,73
(UNSD — Energy
Statistics n.d.)
Taiwan
66,68
(MOEA 2019)
Australia
22,21
(UNSD — Energy
Statistics n.d.)
Korea
155,57
(UNSD — Energy
Statistics n.d.)
Table 5.9 Pig iron production from BF-BOF process in Mt yr −1
Country
Option 1: BF-BOF
steel
manufacturing
(World Steel
Association 2019)
Recycled metal
share in %
Option 2:
Iron ore DRI-EAF
steel manufacturing
Recycled metal
DRI-EAF steel
manufacturing
Japan
77,33
32% (Åhman
et al. 2018)
52,58
24,74
China
771,05
11% (Dolci
2018)
686,24
84,82
Korea
3,88
39% (Dolci
2018)
2,37
1,51
Taiwan
47,12
30% (assumed) 32,99
14,14
Australia 14,84
30% (assumed) 10,39
4,45
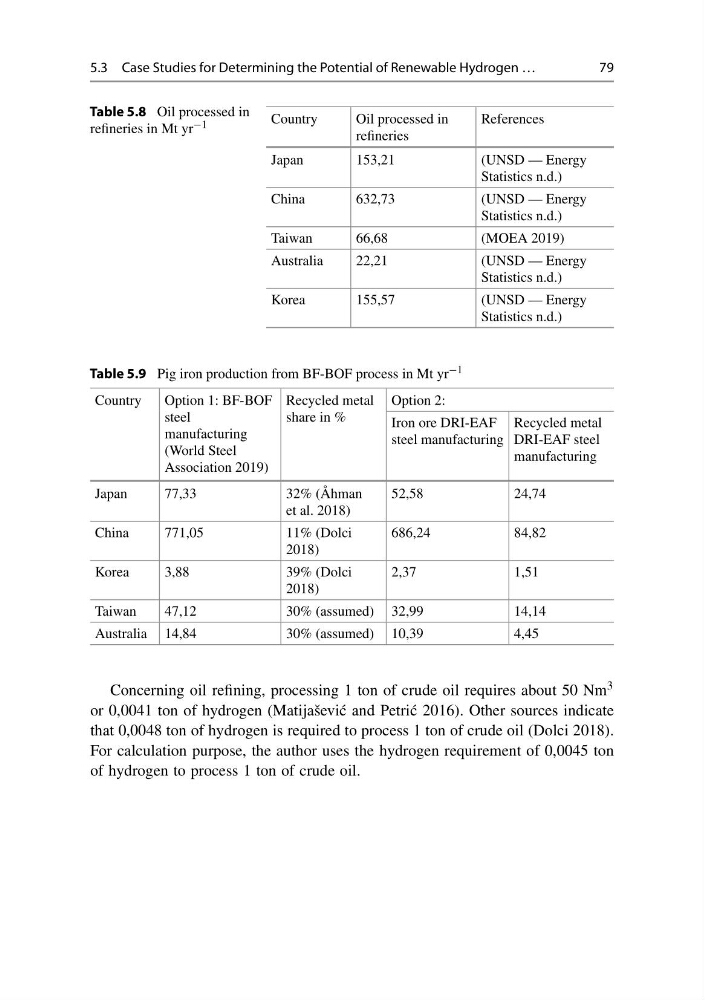
Concerning oil refining, processing 1 ton of crude oil requires about 50 Nm 3
or 0,0041 ton of hydrogen (Matijaševi´ c and Petri´ c 2016). Other sources indicate
that 0,0048 ton of hydrogen is required to process 1 ton of crude oil (Dolci 2018).
For calculation purpose, the author uses the hydrogen requirement of 0,0045 ton
of hydrogen to process 1 ton of crude oil.
79
Table 5.8 Oil processed in
refineries in Mt yr −1
Country
Oil processed in
refineries
References
Japan
153,21
(UNSD — Energy
Statistics n.d.)
China
632,73
(UNSD — Energy
Statistics n.d.)
Taiwan
66,68
(MOEA 2019)
Australia
22,21
(UNSD — Energy
Statistics n.d.)
Korea
155,57
(UNSD — Energy
Statistics n.d.)
Table 5.9 Pig iron production from BF-BOF process in Mt yr −1
Country
Option 1: BF-BOF
steel
manufacturing
(World Steel
Association 2019)
Recycled metal
share in %
Option 2:
Iron ore DRI-EAF
steel manufacturing
Recycled metal
DRI-EAF steel
manufacturing
Japan
77,33
32% (Åhman
et al. 2018)
52,58
24,74
China
771,05
11% (Dolci
2018)
686,24
84,82
Korea
3,88
39% (Dolci
2018)
2,37
1,51
Taiwan
47,12
30% (assumed) 32,99
14,14
Australia 14,84
30% (assumed) 10,39
4,45
Concerning oil refining, processing 1 ton of crude oil requires about 50 Nm 3
or 0,0041 ton of hydrogen (Matijaševi´ c and Petri´ c 2016). Other sources indicate
that 0,0048 ton of hydrogen is required to process 1 ton of crude oil (Dolci 2018).
For calculation purpose, the author uses the hydrogen requirement of 0,0045 ton
of hydrogen to process 1 ton of crude oil.