

5.3 Case Studies for Determining the Potential of Renewable Hydrogen …
77
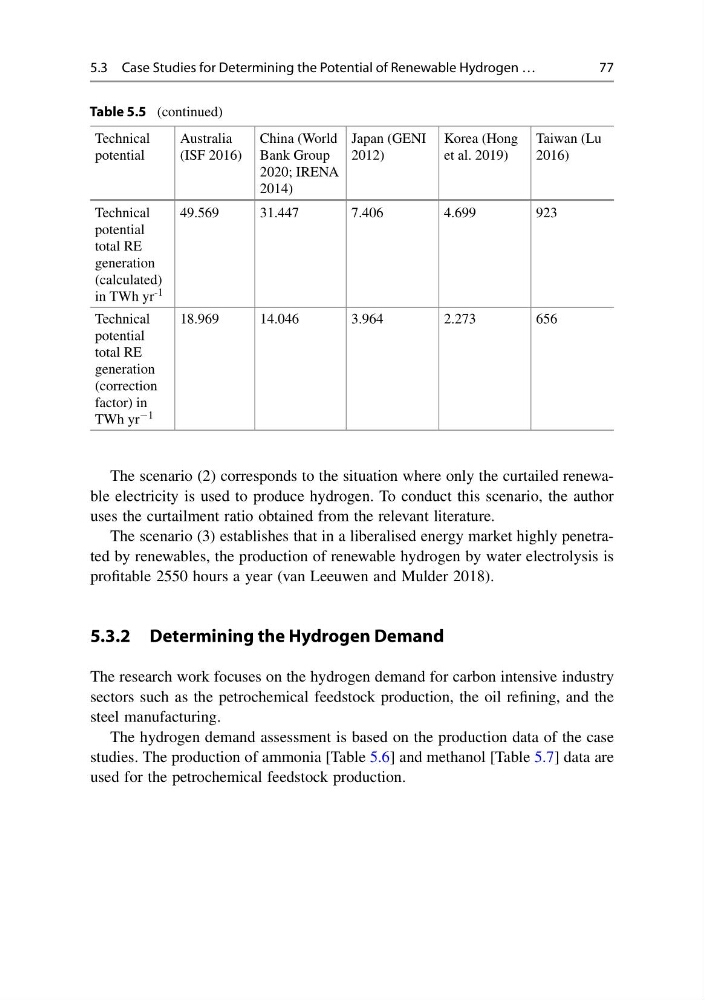
Table 5.5 (continued)
Technical
potential
Australia
(ISF 2016)
China (World
Bank Group
2020; IRENA
2014)
Japan (GENI
2012)
Korea (Hong
et al. 2019)
Taiwan (Lu
2016)
Technical
potential
total RE
generation
(calculated)
in TWh yr -1
49.569
31.447
7.406
4.699
923
Technical
potential
total RE
generation
(correction
factor) in
TWh yr −1
18.969
14.046
3.964
2.273
656
The scenario (2) corresponds to the situation where only the curtailed renewable electricity is used to produce hydrogen. To conduct this scenario, the author
uses the curtailment ratio obtained from the relevant literature.
The scenario (3) establishes that in a liberalised energy market highly penetrated by renewables, the production of renewable hydrogen by water electrolysis is
profitable 2550 hours a year (van Leeuwen and Mulder 2018).
5.3.2 Determining the Hydrogen Demand
The research work focuses on the hydrogen demand for carbon intensive industry
sectors such as the petrochemical feedstock production, the oil refining, and the
steel manufacturing.
The hydrogen demand assessment is based on the production data of the case
studies. The production of ammonia [Table 5.6] and methanol [Table 5.7] data are
used for the petrochemical feedstock production.
77
Table 5.5 (continued)
Technical
potential
Australia
(ISF 2016)
China (World
Bank Group
2020; IRENA
2014)
Japan (GENI
2012)
Korea (Hong
et al. 2019)
Taiwan (Lu
2016)
Technical
potential
total RE
generation
(calculated)
in TWh yr -1
49.569
31.447
7.406
4.699
923
Technical
potential
total RE
generation
(correction
factor) in
TWh yr −1
18.969
14.046
3.964
2.273
656
The scenario (2) corresponds to the situation where only the curtailed renewable electricity is used to produce hydrogen. To conduct this scenario, the author
uses the curtailment ratio obtained from the relevant literature.
The scenario (3) establishes that in a liberalised energy market highly penetrated by renewables, the production of renewable hydrogen by water electrolysis is
profitable 2550 hours a year (van Leeuwen and Mulder 2018).
5.3.2 Determining the Hydrogen Demand
The research work focuses on the hydrogen demand for carbon intensive industry
sectors such as the petrochemical feedstock production, the oil refining, and the
steel manufacturing.
The hydrogen demand assessment is based on the production data of the case
studies. The production of ammonia [Table 5.6] and methanol [Table 5.7] data are
used for the petrochemical feedstock production.