

6.3 Optimization Experiments
175
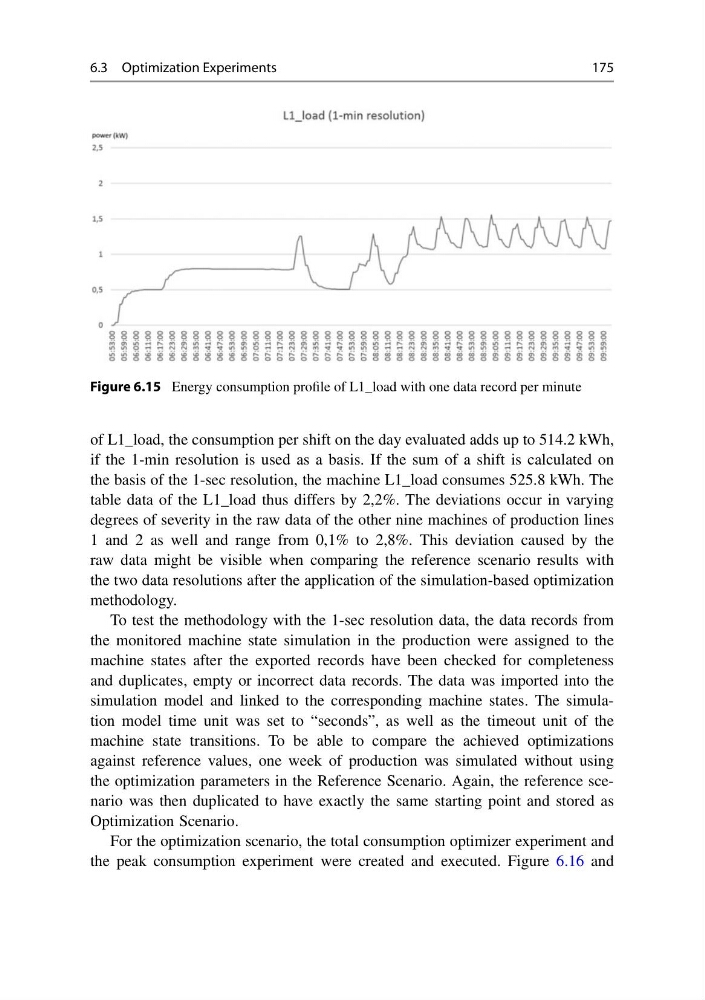
Figure 6.15 Energy consumption profile of L1_load with one data record per minute
of L1_load, the consumption per shift on the day evaluated adds up to 514.2 kWh,
if the 1-min resolution is used as a basis. If the sum of a shift is calculated on
the basis of the 1-sec resolution, the machine L1_load consumes 525.8 kWh. The
table data of the L1_load thus differs by 2,2%. The deviations occur in varying
degrees of severity in the raw data of the other nine machines of production lines
1 and 2 as well and range from 0,1% to 2,8%. This deviation caused by the
raw data might be visible when comparing the reference scenario results with
the two data resolutions after the application of the simulation-based optimization
methodology.
To test the methodology with the 1-sec resolution data, the data records from
the monitored machine state simulation in the production were assigned to the
machine states after the exported records have been checked for completeness
and duplicates, empty or incorrect data records. The data was imported into the
simulation model and linked to the corresponding machine states. The simulation model time unit was set to “seconds”, as well as the timeout unit of the
machine state transitions. To be able to compare the achieved optimizations
against reference values, one week of production was simulated without using
the optimization parameters in the Reference Scenario. Again, the reference scenario was then duplicated to have exactly the same starting point and stored as
Optimization Scenario.
For the optimization scenario, the total consumption optimizer experiment and
the peak consumption experiment were created and executed. Figure 6.16 and
175
Figure 6.15 Energy consumption profile of L1_load with one data record per minute
of L1_load, the consumption per shift on the day evaluated adds up to 514.2 kWh,
if the 1-min resolution is used as a basis. If the sum of a shift is calculated on
the basis of the 1-sec resolution, the machine L1_load consumes 525.8 kWh. The
table data of the L1_load thus differs by 2,2%. The deviations occur in varying
degrees of severity in the raw data of the other nine machines of production lines
1 and 2 as well and range from 0,1% to 2,8%. This deviation caused by the
raw data might be visible when comparing the reference scenario results with
the two data resolutions after the application of the simulation-based optimization
methodology.
To test the methodology with the 1-sec resolution data, the data records from
the monitored machine state simulation in the production were assigned to the
machine states after the exported records have been checked for completeness
and duplicates, empty or incorrect data records. The data was imported into the
simulation model and linked to the corresponding machine states. The simulation model time unit was set to “seconds”, as well as the timeout unit of the
machine state transitions. To be able to compare the achieved optimizations
against reference values, one week of production was simulated without using
the optimization parameters in the Reference Scenario. Again, the reference scenario was then duplicated to have exactly the same starting point and stored as
Optimization Scenario.
For the optimization scenario, the total consumption optimizer experiment and
the peak consumption experiment were created and executed. Figure 6.16 and