

174
6 Experimental Validation of the Methodology
6.3.3 Simulation-based Optimization using the 1-sec
Resolution
The machine controllers of the production machines under consideration were
technically not suitable for recording energy data with a resolution of one dataset
per second. For this reason, external voltage quality measuring devices (Janitza
UMG 604 EP) were temporarily installed to document four weeks of energy data
for each machine. The raw data of the external measuring devices was compared
with the data measured by the machine controllers during the same period. Using
the example of L1_load, the deviations found in the data are shown.
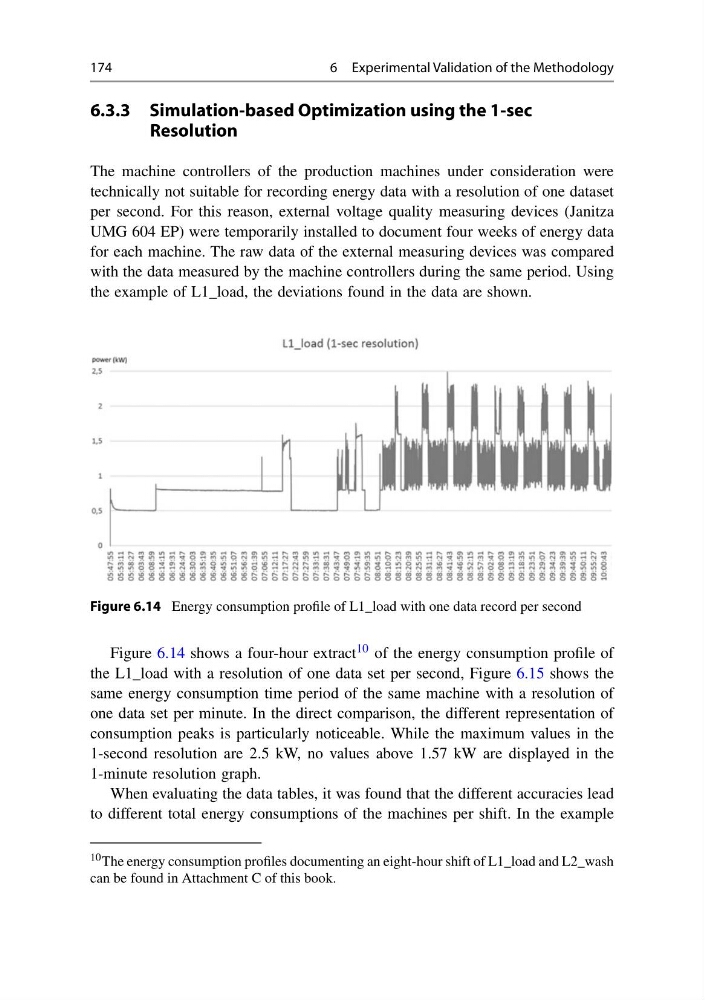
Figure 6.14 Energy consumption profile of L1_load with one data record per second
Figure 6.14 shows a four-hour extract 10 of the energy consumption profile of
the L1_load with a resolution of one data set per second, Figure 6.15 shows the
same energy consumption time period of the same machine with a resolution of
one data set per minute. In the direct comparison, the different representation of
consumption peaks is particularly noticeable. While the maximum values in the
1-second resolution are 2.5 kW, no values above 1.57 kW are displayed in the
1-minute resolution graph.
When evaluating the data tables, it was found that the different accuracies lead
to different total energy consumptions of the machines per shift. In the example
10 The energy consumption profiles documenting an eight-hour shift of L1_load and L2_wash
can be found in Attachment C of this book.
6 Experimental Validation of the Methodology
6.3.3 Simulation-based Optimization using the 1-sec
Resolution
The machine controllers of the production machines under consideration were
technically not suitable for recording energy data with a resolution of one dataset
per second. For this reason, external voltage quality measuring devices (Janitza
UMG 604 EP) were temporarily installed to document four weeks of energy data
for each machine. The raw data of the external measuring devices was compared
with the data measured by the machine controllers during the same period. Using
the example of L1_load, the deviations found in the data are shown.
Figure 6.14 Energy consumption profile of L1_load with one data record per second
Figure 6.14 shows a four-hour extract 10 of the energy consumption profile of
the L1_load with a resolution of one data set per second, Figure 6.15 shows the
same energy consumption time period of the same machine with a resolution of
one data set per minute. In the direct comparison, the different representation of
consumption peaks is particularly noticeable. While the maximum values in the
1-second resolution are 2.5 kW, no values above 1.57 kW are displayed in the
1-minute resolution graph.
When evaluating the data tables, it was found that the different accuracies lead
to different total energy consumptions of the machines per shift. In the example
10 The energy consumption profiles documenting an eight-hour shift of L1_load and L2_wash
can be found in Attachment C of this book.