

176
6 Experimental Validation of the Methodology
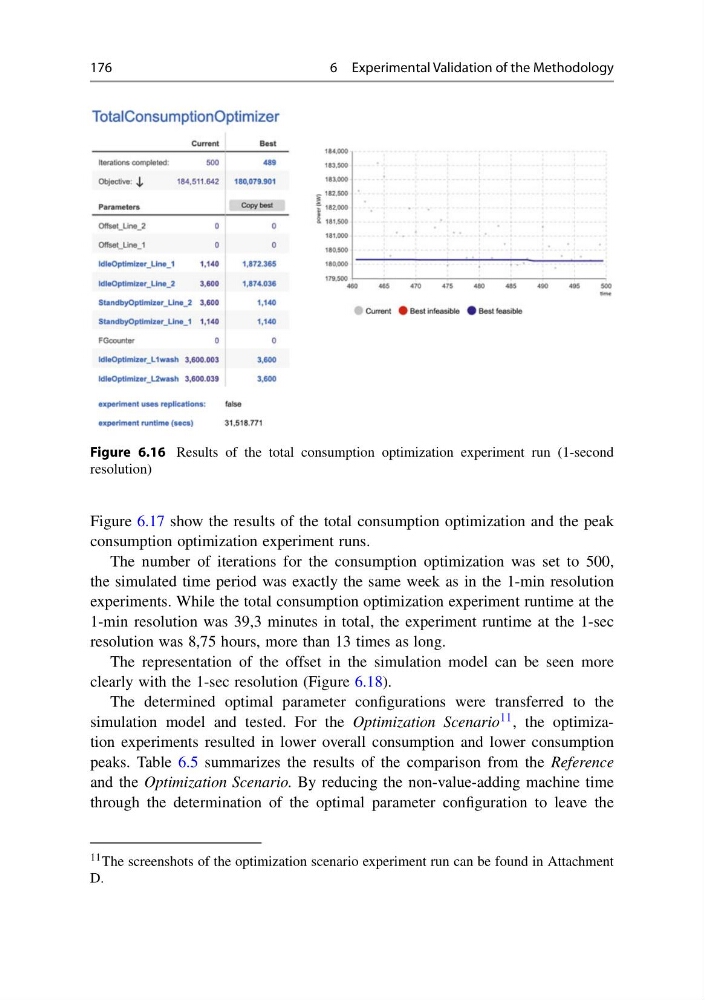
Figure 6.16 Results of the total consumption optimization experiment run (1-second
resolution)
Figure 6.17 show the results of the total consumption optimization and the peak
consumption optimization experiment runs.
The number of iterations for the consumption optimization was set to 500,
the simulated time period was exactly the same week as in the 1-min resolution
experiments. While the total consumption optimization experiment runtime at the
1-min resolution was 39,3 minutes in total, the experiment runtime at the 1-sec
resolution was 8,75 hours, more than 13 times as long.
The representation of the offset in the simulation model can be seen more
clearly with the 1-sec resolution (Figure 6.18).
The determined optimal parameter configurations were transferred to the
simulation model and tested. For the Optimization Scenario 11 , the optimization experiments resulted in lower overall consumption and lower consumption
peaks. Table 6.5 summarizes the results of the comparison from the Reference
and the Optimization Scenario. By reducing the non-value-adding machine time
through the determination of the optimal parameter configuration to leave the
11 The screenshots of the optimization scenario experiment run can be found in Attachment
D.
6 Experimental Validation of the Methodology
Figure 6.16 Results of the total consumption optimization experiment run (1-second
resolution)
Figure 6.17 show the results of the total consumption optimization and the peak
consumption optimization experiment runs.
The number of iterations for the consumption optimization was set to 500,
the simulated time period was exactly the same week as in the 1-min resolution
experiments. While the total consumption optimization experiment runtime at the
1-min resolution was 39,3 minutes in total, the experiment runtime at the 1-sec
resolution was 8,75 hours, more than 13 times as long.
The representation of the offset in the simulation model can be seen more
clearly with the 1-sec resolution (Figure 6.18).
The determined optimal parameter configurations were transferred to the
simulation model and tested. For the Optimization Scenario 11 , the optimization experiments resulted in lower overall consumption and lower consumption
peaks. Table 6.5 summarizes the results of the comparison from the Reference
and the Optimization Scenario. By reducing the non-value-adding machine time
through the determination of the optimal parameter configuration to leave the
11 The screenshots of the optimization scenario experiment run can be found in Attachment
D.