

148
5 Development of a Simulation-based Methodology …
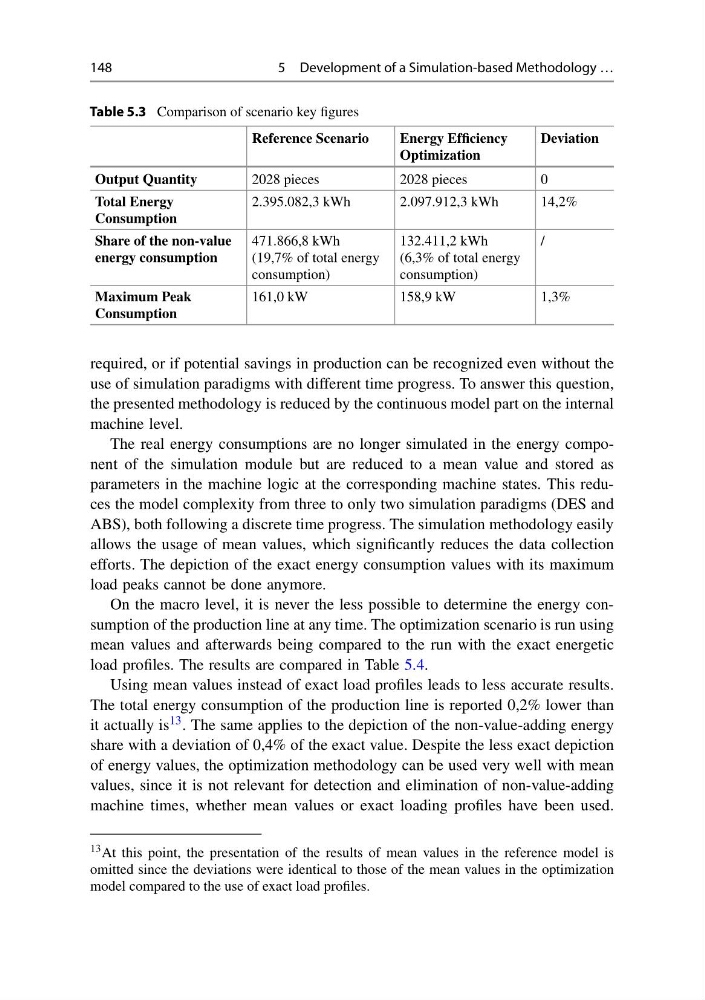
Table 5.3 Comparison of scenario key figures
Reference Scenario
Energy Efficiency
Optimization
Deviation
Output Quantity
2028 pieces
2028 pieces
0
Total Energy
Consumption
2.395.082,3 kWh
2.097.912,3 kWh
14,2%
Share of the non-value
energy consumption
471.866,8 kWh
(19,7% of total energy
consumption)
132.411,2 kWh
(6,3% of total energy
consumption)
/
Maximum Peak
Consumption
161,0 kW
158,9 kW
1,3%
required, or if potential savings in production can be recognized even without the
use of simulation paradigms with different time progress. To answer this question,
the presented methodology is reduced by the continuous model part on the internal
machine level.
The real energy consumptions are no longer simulated in the energy component of the simulation module but are reduced to a mean value and stored as
parameters in the machine logic at the corresponding machine states. This reduces the model complexity from three to only two simulation paradigms (DES and
ABS), both following a discrete time progress. The simulation methodology easily
allows the usage of mean values, which significantly reduces the data collection
efforts. The depiction of the exact energy consumption values with its maximum
load peaks cannot be done anymore.
On the macro level, it is never the less possible to determine the energy consumption of the production line at any time. The optimization scenario is run using
mean values and afterwards being compared to the run with the exact energetic
load profiles. The results are compared in Table 5.4.
Using mean values instead of exact load profiles leads to less accurate results.
The total energy consumption of the production line is reported 0,2% lower than
it actually is 13 . The same applies to the depiction of the non-value-adding energy
share with a deviation of 0,4% of the exact value. Despite the less exact depiction
of energy values, the optimization methodology can be used very well with mean
values, since it is not relevant for detection and elimination of non-value-adding
machine times, whether mean values or exact loading profiles have been used.
13 At this point, the presentation of the results of mean values in the reference model is
omitted since the deviations were identical to those of the mean values in the optimization
model compared to the use of exact load profiles.
5 Development of a Simulation-based Methodology …
Table 5.3 Comparison of scenario key figures
Reference Scenario
Energy Efficiency
Optimization
Deviation
Output Quantity
2028 pieces
2028 pieces
0
Total Energy
Consumption
2.395.082,3 kWh
2.097.912,3 kWh
14,2%
Share of the non-value
energy consumption
471.866,8 kWh
(19,7% of total energy
consumption)
132.411,2 kWh
(6,3% of total energy
consumption)
/
Maximum Peak
Consumption
161,0 kW
158,9 kW
1,3%
required, or if potential savings in production can be recognized even without the
use of simulation paradigms with different time progress. To answer this question,
the presented methodology is reduced by the continuous model part on the internal
machine level.
The real energy consumptions are no longer simulated in the energy component of the simulation module but are reduced to a mean value and stored as
parameters in the machine logic at the corresponding machine states. This reduces the model complexity from three to only two simulation paradigms (DES and
ABS), both following a discrete time progress. The simulation methodology easily
allows the usage of mean values, which significantly reduces the data collection
efforts. The depiction of the exact energy consumption values with its maximum
load peaks cannot be done anymore.
On the macro level, it is never the less possible to determine the energy consumption of the production line at any time. The optimization scenario is run using
mean values and afterwards being compared to the run with the exact energetic
load profiles. The results are compared in Table 5.4.
Using mean values instead of exact load profiles leads to less accurate results.
The total energy consumption of the production line is reported 0,2% lower than
it actually is 13 . The same applies to the depiction of the non-value-adding energy
share with a deviation of 0,4% of the exact value. Despite the less exact depiction
of energy values, the optimization methodology can be used very well with mean
values, since it is not relevant for detection and elimination of non-value-adding
machine times, whether mean values or exact loading profiles have been used.
13 At this point, the presentation of the results of mean values in the reference model is
omitted since the deviations were identical to those of the mean values in the optimization
model compared to the use of exact load profiles.