

exhibit shifts for different chemical states of an element, just as observed for
absorption edges or XPS binding energies. The magnitude of these shifts allows
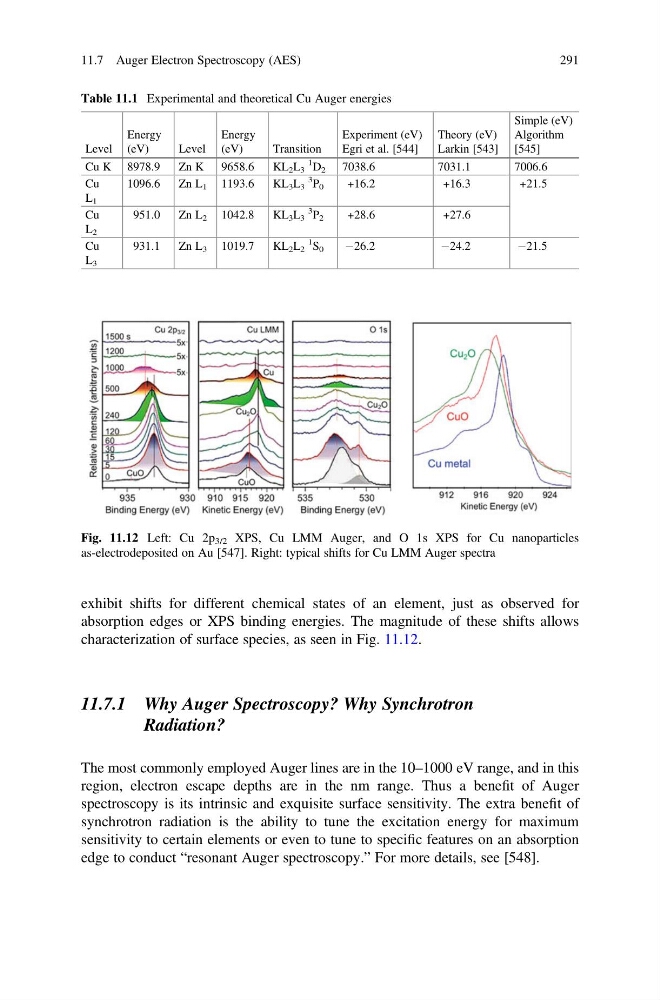
characterization of surface species, as seen in Fig. 11.12.
11.7.1 Why Auger Spectroscopy? Why Synchrotron
Radiation?
The most commonly employed Auger lines are in the 10–1000 eV range, and in this
region, electron escape depths are in the nm range. Thus a benefit of Auger
spectroscopy is its intrinsic and exquisite surface sensitivity. The extra benefit of
synchrotron radiation is the ability to tune the excitation energy for maximum
sensitivity to certain elements or even to tune to specific features on an absorption
edge to conduct “resonant Auger spectroscopy.” For more details, see [548].
Table 11.1 Experimental and theoretical Cu Auger energies
Level
Energy
(eV)
Level
Energy
(eV)
Transition
Experiment (eV)
Egri et al. [544]
Theory (eV)
Larkin [543]
Simple (eV)
Algorithm
[545]
Cu K 8978.9
Zn K 9658.6
KL 2 L 3
1 D 2 7038.6
7031.1
7006.6
Cu
L 1
1096.6
Zn L 1 1193.6
KL 3 L 3
3 P 0
+16.2
+16.3
+21.5
Cu
L 2
951.0
Zn L 2 1042.8
KL 3 L 3
3 P 2
+28.6
+27.6
Cu
L 3
931.1
Zn L 3 1019.7
KL 2 L 2
1 S 0
À26.2
À24.2
À21.5
Fig. 11.12 Left: Cu 2p 3/2 XPS, Cu LMM Auger, and O 1s XPS for Cu nanoparticles
as-electrodeposited on Au [547]. Right: typical shifts for Cu LMM Auger spectra
11.7 Auger Electron Spectroscopy (AES)
291
absorption edges or XPS binding energies. The magnitude of these shifts allows
characterization of surface species, as seen in Fig. 11.12.
11.7.1 Why Auger Spectroscopy? Why Synchrotron
Radiation?
The most commonly employed Auger lines are in the 10–1000 eV range, and in this
region, electron escape depths are in the nm range. Thus a benefit of Auger
spectroscopy is its intrinsic and exquisite surface sensitivity. The extra benefit of
synchrotron radiation is the ability to tune the excitation energy for maximum
sensitivity to certain elements or even to tune to specific features on an absorption
edge to conduct “resonant Auger spectroscopy.” For more details, see [548].
Table 11.1 Experimental and theoretical Cu Auger energies
Level
Energy
(eV)
Level
Energy
(eV)
Transition
Experiment (eV)
Egri et al. [544]
Theory (eV)
Larkin [543]
Simple (eV)
Algorithm
[545]
Cu K 8978.9
Zn K 9658.6
KL 2 L 3
1 D 2 7038.6
7031.1
7006.6
Cu
L 1
1096.6
Zn L 1 1193.6
KL 3 L 3
3 P 0
+16.2
+16.3
+21.5
Cu
L 2
951.0
Zn L 2 1042.8
KL 3 L 3
3 P 2
+28.6
+27.6
Cu
L 3
931.1
Zn L 3 1019.7
KL 2 L 2
1 S 0
À26.2
À24.2
À21.5
Fig. 11.12 Left: Cu 2p 3/2 XPS, Cu LMM Auger, and O 1s XPS for Cu nanoparticles
as-electrodeposited on Au [547]. Right: typical shifts for Cu LMM Auger spectra
11.7 Auger Electron Spectroscopy (AES)
291