

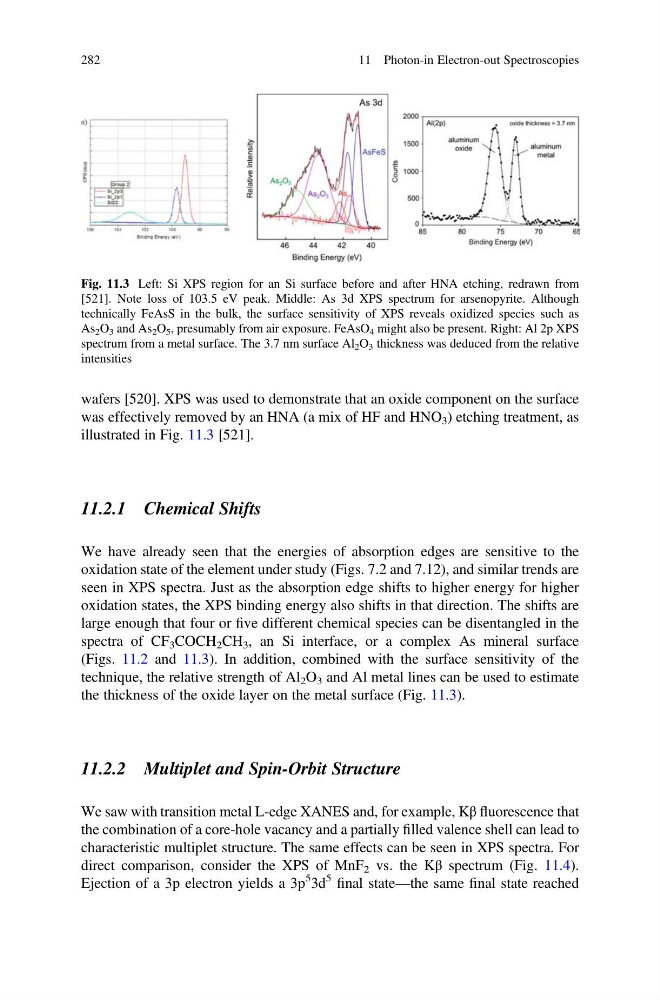
wafers [520]. XPS was used to demonstrate that an oxide component on the surface
was effectively removed by an HNA (a mix of HF and HNO 3 ) etching treatment, as
illustrated in Fig. 11.3 [521].
11.2.1 Chemical Shifts
We have already seen that the energies of absorption edges are sensitive to the
oxidation state of the element under study (Figs. 7.2 and 7.12), and similar trends are
seen in XPS spectra. Just as the absorption edge shifts to higher energy for higher
oxidation states, the XPS binding energy also shifts in that direction. The shifts are
large enough that four or five different chemical species can be disentangled in the
spectra of CF 3 COCH 2 CH 3 , an Si interface, or a complex As mineral surface
(Figs. 11.2 and 11.3). In addition, combined with the surface sensitivity of the
technique, the relative strength of Al 2 O 3 and Al metal lines can be used to estimate
the thickness of the oxide layer on the metal surface (Fig. 11.3).
11.2.2 Multiplet and Spin-Orbit Structure
We saw with transition metal L-edge XANES and, for example, Kβ fluorescence that
the combination of a core-hole vacancy and a partially filled valence shell can lead to
characteristic multiplet structure. The same effects can be seen in XPS spectra. For
direct comparison, consider the XPS of MnF 2 vs. the Kβ spectrum (Fig. 11.4).
Ejection of a 3p electron yields a 3p
5 3d
5
final state—the same final state reached
Fig. 11.3 Left: Si XPS region for an Si surface before and after HNA etching, redrawn from
[521]. Note loss of 103.5 eV peak. Middle: As 3d XPS spectrum for arsenopyrite. Although
technically FeAsS in the bulk, the surface sensitivity of XPS reveals oxidized species such as
As 2 O 3 and As 2 O 5 , presumably from air exposure. FeAsO 4 might also be present. Right: Al 2p XPS
spectrum from a metal surface. The 3.7 nm surface Al 2 O 3 thickness was deduced from the relative
intensities
282
11 Photon-in Electron-out Spectroscopies
was effectively removed by an HNA (a mix of HF and HNO 3 ) etching treatment, as
illustrated in Fig. 11.3 [521].
11.2.1 Chemical Shifts
We have already seen that the energies of absorption edges are sensitive to the
oxidation state of the element under study (Figs. 7.2 and 7.12), and similar trends are
seen in XPS spectra. Just as the absorption edge shifts to higher energy for higher
oxidation states, the XPS binding energy also shifts in that direction. The shifts are
large enough that four or five different chemical species can be disentangled in the
spectra of CF 3 COCH 2 CH 3 , an Si interface, or a complex As mineral surface
(Figs. 11.2 and 11.3). In addition, combined with the surface sensitivity of the
technique, the relative strength of Al 2 O 3 and Al metal lines can be used to estimate
the thickness of the oxide layer on the metal surface (Fig. 11.3).
11.2.2 Multiplet and Spin-Orbit Structure
We saw with transition metal L-edge XANES and, for example, Kβ fluorescence that
the combination of a core-hole vacancy and a partially filled valence shell can lead to
characteristic multiplet structure. The same effects can be seen in XPS spectra. For
direct comparison, consider the XPS of MnF 2 vs. the Kβ spectrum (Fig. 11.4).
Ejection of a 3p electron yields a 3p
5 3d
5
final state—the same final state reached
Fig. 11.3 Left: Si XPS region for an Si surface before and after HNA etching, redrawn from
[521]. Note loss of 103.5 eV peak. Middle: As 3d XPS spectrum for arsenopyrite. Although
technically FeAsS in the bulk, the surface sensitivity of XPS reveals oxidized species such as
As 2 O 3 and As 2 O 5 , presumably from air exposure. FeAsO 4 might also be present. Right: Al 2p XPS
spectrum from a metal surface. The 3.7 nm surface Al 2 O 3 thickness was deduced from the relative
intensities
282
11 Photon-in Electron-out Spectroscopies