

I E
ð Þ ¼
Z 1
À1
R E À E
0
ð
Þ
|fflfflfflfflfflffl{zfflfflfflfflfflffl}
resolution
faS E
0
ð Þ
|fflfflffl ffl{zfflfflffl ffl}
NRVS
À b δ E
0
ð Þ
|ffl{zffl}
M€ ossbauer
gdE
0
ð10:26Þ
where parameter a is a normalization constant and b is a value that accounts for
saturation effects when on the Mössbauer resonance. The shape of R(E) is obtained
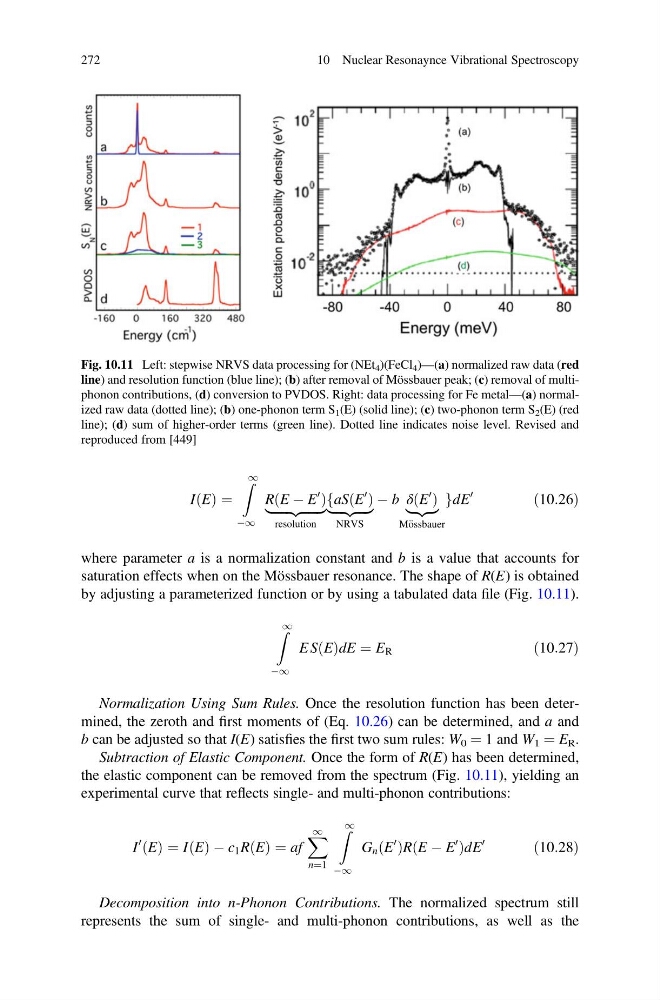
by adjusting a parameterized function or by using a tabulated data file (Fig. 10.11).
Z 1
À1
E S E
ð ÞdE ¼ E R
ð10:27Þ
Normalization Using Sum Rules. Once the resolution function has been determined, the zeroth and first moments of (Eq. 10.26) can be determined, and a and
b can be adjusted so that I(E) satisfies the first two sum rules: W 0 ¼ 1 and W 1 ¼ E R .
Subtraction of Elastic Component. Once the form of R(E) has been determined,
the elastic component can be removed from the spectrum (Fig. 10.11), yielding an
experimental curve that reflects single- and multi-phonon contributions:
I
0 E
ð Þ ¼ I E
ð Þ À c 1 R E
ð Þ ¼ af
X 1
n¼1
Z 1
À1
G n E
0
ð ÞR E À E
0
ð
ÞdE
0
ð10:28Þ
Decomposition into n-Phonon Contributions. The normalized spectrum still
represents the sum of single- and multi-phonon contributions, as well as the
Fig. 10.11 Left: stepwise NRVS data processing for (NEt 4 )(FeCl 4 )—(a) normalized raw data (red
line) and resolution function (blue line); (b) after removal of Mössbauer peak; (c) removal of multiphonon contributions, (d) conversion to PVDOS. Right: data processing for Fe metal—(a) normalized raw data (dotted line); (b) one-phonon term S 1 (E) (solid line); (c) two-phonon term S 2 (E) (red
line); (d) sum of higher-order terms (green line). Dotted line indicates noise level. Revised and
reproduced from [449]
272
10 Nuclear Resonaynce Vibrational Spectroscopy
ð Þ ¼
Z 1
À1
R E À E
0
ð
Þ
|fflfflfflfflfflffl{zfflfflfflfflfflffl}
resolution
faS E
0
ð Þ
|fflfflffl ffl{zfflfflffl ffl}
NRVS
À b δ E
0
ð Þ
|ffl{zffl}
M€ ossbauer
gdE
0
ð10:26Þ
where parameter a is a normalization constant and b is a value that accounts for
saturation effects when on the Mössbauer resonance. The shape of R(E) is obtained
by adjusting a parameterized function or by using a tabulated data file (Fig. 10.11).
Z 1
À1
E S E
ð ÞdE ¼ E R
ð10:27Þ
Normalization Using Sum Rules. Once the resolution function has been determined, the zeroth and first moments of (Eq. 10.26) can be determined, and a and
b can be adjusted so that I(E) satisfies the first two sum rules: W 0 ¼ 1 and W 1 ¼ E R .
Subtraction of Elastic Component. Once the form of R(E) has been determined,
the elastic component can be removed from the spectrum (Fig. 10.11), yielding an
experimental curve that reflects single- and multi-phonon contributions:
I
0 E
ð Þ ¼ I E
ð Þ À c 1 R E
ð Þ ¼ af
X 1
n¼1
Z 1
À1
G n E
0
ð ÞR E À E
0
ð
ÞdE
0
ð10:28Þ
Decomposition into n-Phonon Contributions. The normalized spectrum still
represents the sum of single- and multi-phonon contributions, as well as the
Fig. 10.11 Left: stepwise NRVS data processing for (NEt 4 )(FeCl 4 )—(a) normalized raw data (red
line) and resolution function (blue line); (b) after removal of Mössbauer peak; (c) removal of multiphonon contributions, (d) conversion to PVDOS. Right: data processing for Fe metal—(a) normalized raw data (dotted line); (b) one-phonon term S 1 (E) (solid line); (c) two-phonon term S 2 (E) (red
line); (d) sum of higher-order terms (green line). Dotted line indicates noise level. Revised and
reproduced from [449]
272
10 Nuclear Resonaynce Vibrational Spectroscopy