

10.5 Data Processing
To compare theory and experiment, we often need to extract the PVDOS from the
experimental data. A variety of programs are available for the analysis of NRVS
spectra, including DOS [496] and PHOENIX [479]. As illustrated schematically in
Fig. 10.11, the key steps in the analysis of NRVS data are:
• Determination of the resolution function R(E À E´)
• Normalization using sum rules
• Subtraction of the elastic component
• Decomposition into n-phonon contributions
• Derivation of the PVDOS
Determination of the Resolution Function R(E). The raw NRVS spectrum consists of a measurement of intensity I(E) vs. energy E. The spectrum in the region of
the Mössbauer (zero-phonon) resonance is effectively a δ-function convolved with
the monochromator resolution function R(E), while the wings of the spectrum
depend on the probability for vibrational excitation, S(E). One can thus express
the raw experimental spectrum as:
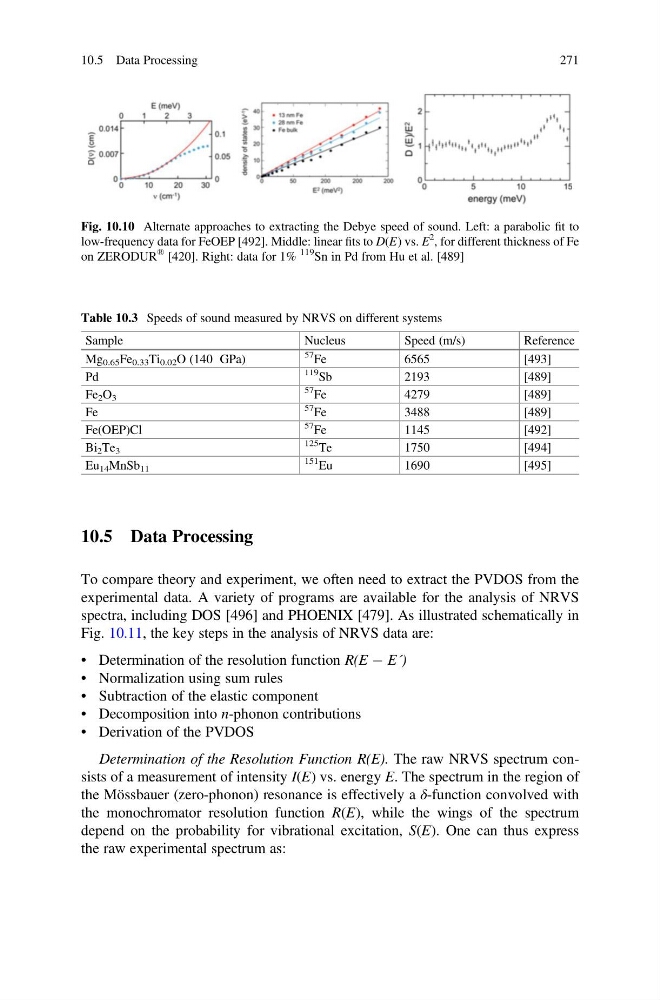
Fig. 10.10 Alternate approaches to extracting the Debye speed of sound. Left: a parabolic fit to
low-frequency data for FeOEP [492]. Middle: linear fits to D(E) vs. E
2
, for different thickness of Fe
on ZERODUR
® [420]. Right: data for 1%
119
Sn in Pd from Hu et al. [489]
Table 10.3 Speeds of sound measured by NRVS on different systems
Sample
Nucleus
Speed (m/s)
Reference
Mg 0.65 Fe 0.33 Ti 0.02 O (140 GPa)
57
Fe
6565
[493]
Pd
119
Sb
2193
[489]
Fe 2 O 3
57
Fe
4279
[489]
Fe
57
Fe
3488
[489]
Fe(OEP)Cl
57
Fe
1145
[492]
Bi 2 Te 3
125
Te
1750
[494]
Eu 14 MnSb 11
151
Eu
1690
[495]
10.5 Data Processing
271
To compare theory and experiment, we often need to extract the PVDOS from the
experimental data. A variety of programs are available for the analysis of NRVS
spectra, including DOS [496] and PHOENIX [479]. As illustrated schematically in
Fig. 10.11, the key steps in the analysis of NRVS data are:
• Determination of the resolution function R(E À E´)
• Normalization using sum rules
• Subtraction of the elastic component
• Decomposition into n-phonon contributions
• Derivation of the PVDOS
Determination of the Resolution Function R(E). The raw NRVS spectrum consists of a measurement of intensity I(E) vs. energy E. The spectrum in the region of
the Mössbauer (zero-phonon) resonance is effectively a δ-function convolved with
the monochromator resolution function R(E), while the wings of the spectrum
depend on the probability for vibrational excitation, S(E). One can thus express
the raw experimental spectrum as:
Fig. 10.10 Alternate approaches to extracting the Debye speed of sound. Left: a parabolic fit to
low-frequency data for FeOEP [492]. Middle: linear fits to D(E) vs. E
2
, for different thickness of Fe
on ZERODUR
® [420]. Right: data for 1%
119
Sn in Pd from Hu et al. [489]
Table 10.3 Speeds of sound measured by NRVS on different systems
Sample
Nucleus
Speed (m/s)
Reference
Mg 0.65 Fe 0.33 Ti 0.02 O (140 GPa)
57
Fe
6565
[493]
Pd
119
Sb
2193
[489]
Fe 2 O 3
57
Fe
4279
[489]
Fe
57
Fe
3488
[489]
Fe(OEP)Cl
57
Fe
1145
[492]
Bi 2 Te 3
125
Te
1750
[494]
Eu 14 MnSb 11
151
Eu
1690
[495]
10.5 Data Processing
271