

By rearranging this equation, the relative strengths of the anti-Stokes and Stokes
transitions at frequencies Æv α can be used to determine the sample temperature.
10.2.3 Multi-Phonon Events: Overtone and Combination
Bands
Again like Raman and IR spectroscopy, an NRVS spectrum also exhibits overtone
bands and combination bands involving changes of two or more phonons. How
significant are they? It all depends on the Lamb-Mössbauer factor. By integrating the
individual S n (E) curves, the n-phonon probabilities are obtained:
P n ¼
Z
S n E
ð ÞdE ¼ f LM
À ln f LM
ð
Þ
n
n!
ð10:9Þ
From this, Sturhahn gives a very simple expression for the average number of
phonons excited over the nuclear excitation spectrum:
n
h i ¼ À ln f LM
ð10:10Þ
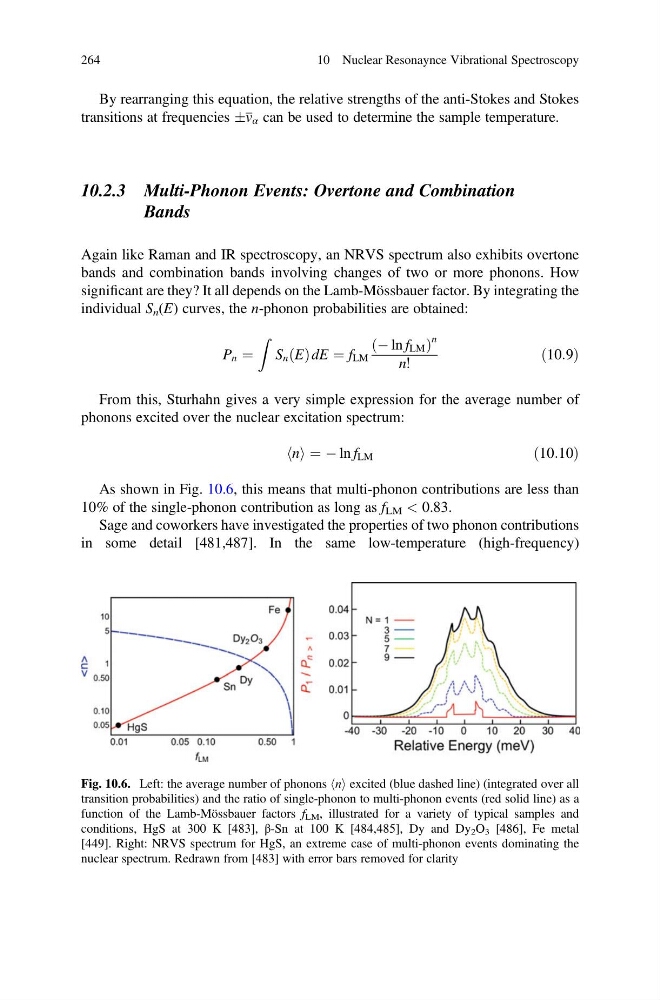
As shown in Fig. 10.6, this means that multi-phonon contributions are less than
10% of the single-phonon contribution as long as f LM < 0.83.
Sage and coworkers have investigated the properties of two phonon contributions
in some detail [481,487]. In the same low-temperature (high-frequency)
Fig. 10.6. Left: the average number of phonons hni excited (blue dashed line) (integrated over all
transition probabilities) and the ratio of single-phonon to multi-phonon events (red solid line) as a
function of the Lamb-Mössbauer factors f LM , illustrated for a variety of typical samples and
conditions, HgS at 300 K [483], β-Sn at 100 K [484,485], Dy and Dy 2 O 3 [486], Fe metal
[449]. Right: NRVS spectrum for HgS, an extreme case of multi-phonon events dominating the
nuclear spectrum. Redrawn from [483] with error bars removed for clarity
264
10 Nuclear Resonaynce Vibrational Spectroscopy
transitions at frequencies Æv α can be used to determine the sample temperature.
10.2.3 Multi-Phonon Events: Overtone and Combination
Bands
Again like Raman and IR spectroscopy, an NRVS spectrum also exhibits overtone
bands and combination bands involving changes of two or more phonons. How
significant are they? It all depends on the Lamb-Mössbauer factor. By integrating the
individual S n (E) curves, the n-phonon probabilities are obtained:
P n ¼
Z
S n E
ð ÞdE ¼ f LM
À ln f LM
ð
Þ
n
n!
ð10:9Þ
From this, Sturhahn gives a very simple expression for the average number of
phonons excited over the nuclear excitation spectrum:
n
h i ¼ À ln f LM
ð10:10Þ
As shown in Fig. 10.6, this means that multi-phonon contributions are less than
10% of the single-phonon contribution as long as f LM < 0.83.
Sage and coworkers have investigated the properties of two phonon contributions
in some detail [481,487]. In the same low-temperature (high-frequency)
Fig. 10.6. Left: the average number of phonons hni excited (blue dashed line) (integrated over all
transition probabilities) and the ratio of single-phonon to multi-phonon events (red solid line) as a
function of the Lamb-Mössbauer factors f LM , illustrated for a variety of typical samples and
conditions, HgS at 300 K [483], β-Sn at 100 K [484,485], Dy and Dy 2 O 3 [486], Fe metal
[449]. Right: NRVS spectrum for HgS, an extreme case of multi-phonon events dominating the
nuclear spectrum. Redrawn from [483] with error bars removed for clarity
264
10 Nuclear Resonaynce Vibrational Spectroscopy