

8.4.3 An Intensity Estimate
How strong is the XRS signal? Sahle and coworkers did a nice calculation using
Eq. 8.16 [389]:
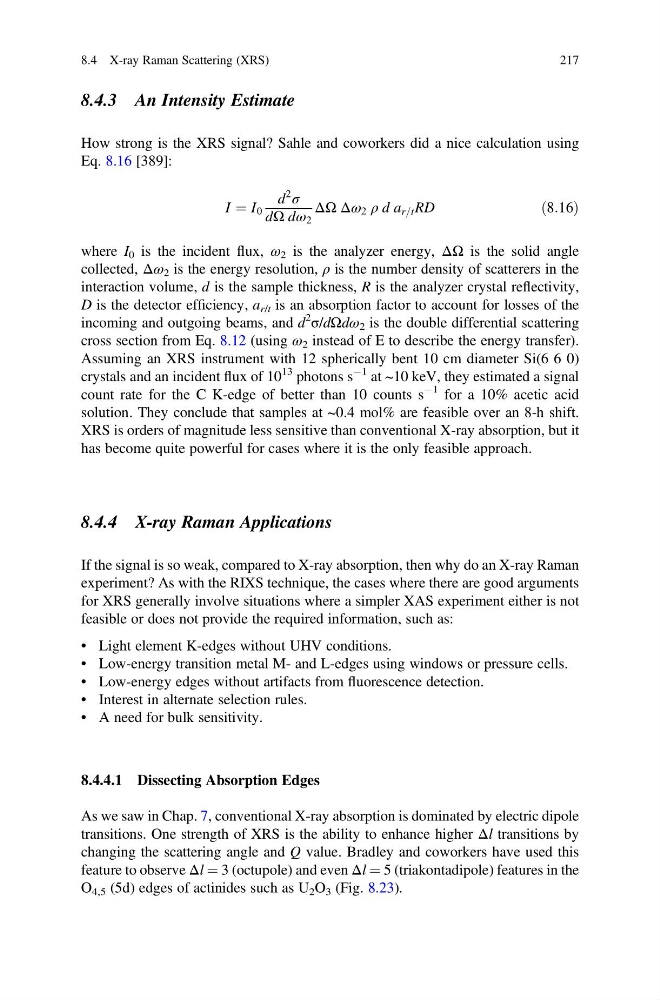
I ¼ I 0
d
2
σ
dΩ dω 2
ΔΩ Δω 2 ρ d a r=t RD
ð8:16Þ
where I 0 is the incident flux, ω 2 is the analyzer energy, ΔΩ is the solid angle
collected, Δω 2 is the energy resolution, ρ is the number density of scatterers in the
interaction volume, d is the sample thickness, R is the analyzer crystal reflectivity,
D is the detector efficiency, a r/t is an absorption factor to account for losses of the
incoming and outgoing beams, and d
2
σ/dΩdω 2 is the double differential scattering
cross section from Eq. 8.12 (using ω 2 instead of E to describe the energy transfer).
Assuming an XRS instrument with 12 spherically bent 10 cm diameter Si(6 6 0)
crystals and an incident flux of 10
13 photons s
À1 at ~10 keV, they estimated a signal
count rate for the C K-edge of better than 10 counts s
À1 for a 10% acetic acid
solution. They conclude that samples at ~0.4 mol% are feasible over an 8-h shift.
XRS is orders of magnitude less sensitive than conventional X-ray absorption, but it
has become quite powerful for cases where it is the only feasible approach.
8.4.4 X-ray Raman Applications
If the signal is so weak, compared to X-ray absorption, then why do an X-ray Raman
experiment? As with the RIXS technique, the cases where there are good arguments
for XRS generally involve situations where a simpler XAS experiment either is not
feasible or does not provide the required information, such as:
• Light element K-edges without UHV conditions.
• Low-energy transition metal M- and L-edges using windows or pressure cells.
• Low-energy edges without artifacts from fluorescence detection.
• Interest in alternate selection rules.
• A need for bulk sensitivity.
8.4.4.1 Dissecting Absorption Edges
As we saw in Chap. 7, conventional X-ray absorption is dominated by electric dipole
transitions. One strength of XRS is the ability to enhance higher Δl transitions by
changing the scattering angle and Q value. Bradley and coworkers have used this
feature to observe Δl ¼ 3 (octupole) and even Δl ¼ 5 (triakontadipole) features in the
O 4,5 (5d) edges of actinides such as U 2 O 3 (Fig. 8.23).
8.4 X-ray Raman Scattering (XRS)
217
How strong is the XRS signal? Sahle and coworkers did a nice calculation using
Eq. 8.16 [389]:
I ¼ I 0
d
2
σ
dΩ dω 2
ΔΩ Δω 2 ρ d a r=t RD
ð8:16Þ
where I 0 is the incident flux, ω 2 is the analyzer energy, ΔΩ is the solid angle
collected, Δω 2 is the energy resolution, ρ is the number density of scatterers in the
interaction volume, d is the sample thickness, R is the analyzer crystal reflectivity,
D is the detector efficiency, a r/t is an absorption factor to account for losses of the
incoming and outgoing beams, and d
2
σ/dΩdω 2 is the double differential scattering
cross section from Eq. 8.12 (using ω 2 instead of E to describe the energy transfer).
Assuming an XRS instrument with 12 spherically bent 10 cm diameter Si(6 6 0)
crystals and an incident flux of 10
13 photons s
À1 at ~10 keV, they estimated a signal
count rate for the C K-edge of better than 10 counts s
À1 for a 10% acetic acid
solution. They conclude that samples at ~0.4 mol% are feasible over an 8-h shift.
XRS is orders of magnitude less sensitive than conventional X-ray absorption, but it
has become quite powerful for cases where it is the only feasible approach.
8.4.4 X-ray Raman Applications
If the signal is so weak, compared to X-ray absorption, then why do an X-ray Raman
experiment? As with the RIXS technique, the cases where there are good arguments
for XRS generally involve situations where a simpler XAS experiment either is not
feasible or does not provide the required information, such as:
• Light element K-edges without UHV conditions.
• Low-energy transition metal M- and L-edges using windows or pressure cells.
• Low-energy edges without artifacts from fluorescence detection.
• Interest in alternate selection rules.
• A need for bulk sensitivity.
8.4.4.1 Dissecting Absorption Edges
As we saw in Chap. 7, conventional X-ray absorption is dominated by electric dipole
transitions. One strength of XRS is the ability to enhance higher Δl transitions by
changing the scattering angle and Q value. Bradley and coworkers have used this
feature to observe Δl ¼ 3 (octupole) and even Δl ¼ 5 (triakontadipole) features in the
O 4,5 (5d) edges of actinides such as U 2 O 3 (Fig. 8.23).
8.4 X-ray Raman Scattering (XRS)
217