

Of course, it’s easier to use a UV-visible spectrometer. But there are many
situations where something else in the sample might obscure the transitions of
interest. Or, there might be something about the experimental apparatus itself that
obscures the region of interest. In such cases a RIXS experiment would allow you to
get the same information.
One example is high-pressure studies using diamond anvil cells. Since pure
diamond has a band gap of 5.5 eV, it is impossible to obtain optical spectra in
these devices for samples at shorter wavelengths than about 225 nm. However, by
using Ni K-edge RIXS, the charge-transfer excitations of NiO samples could be
studied from standard conditions all the way to 100 GPa (almost one million atm)
[362]. The normal atmospheric pressure spectra showed features from 4 to 12 eV
that agreed well with UV reflectance data (Fig. 8.17). For example, in both cases the
onset of the O ! Ni charge-transfer band appears just below ~4 eV. This edge
stayed relatively constant with increasing pressure, whereas the maximum at
~8.5 eV shifted continuously to higher energies. Data like this could not be obtained
in a conventional UV transmission or reflectance experiment.
Charge-transfer excitations are also visible in L-edge RIXS. Remember that in
discussing L-edge or Kβ features with the charge-transfer model, the ground state
was written as a configuration interaction between a purely ionic configuration and a
configuration with an electron transferred from the ligand: α3d
8 + β3d
9 L (Fig. 8.17).
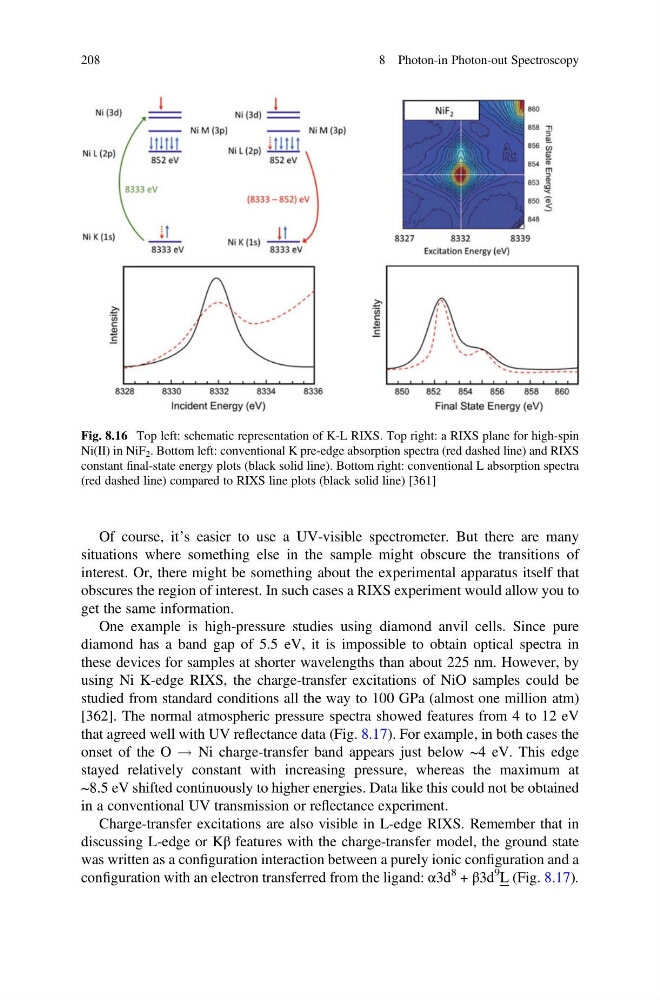
Fig. 8.16 Top left: schematic representation of K-L RIXS. Top right: a RIXS plane for high-spin
Ni(II) in NiF 2 . Bottom left: conventional K pre-edge absorption spectra (red dashed line) and RIXS
constant final-state energy plots (black solid line). Bottom right: conventional L absorption spectra
(red dashed line) compared to RIXS line plots (black solid line) [361]
208
8 Photon-in Photon-out Spectroscopy
situations where something else in the sample might obscure the transitions of
interest. Or, there might be something about the experimental apparatus itself that
obscures the region of interest. In such cases a RIXS experiment would allow you to
get the same information.
One example is high-pressure studies using diamond anvil cells. Since pure
diamond has a band gap of 5.5 eV, it is impossible to obtain optical spectra in
these devices for samples at shorter wavelengths than about 225 nm. However, by
using Ni K-edge RIXS, the charge-transfer excitations of NiO samples could be
studied from standard conditions all the way to 100 GPa (almost one million atm)
[362]. The normal atmospheric pressure spectra showed features from 4 to 12 eV
that agreed well with UV reflectance data (Fig. 8.17). For example, in both cases the
onset of the O ! Ni charge-transfer band appears just below ~4 eV. This edge
stayed relatively constant with increasing pressure, whereas the maximum at
~8.5 eV shifted continuously to higher energies. Data like this could not be obtained
in a conventional UV transmission or reflectance experiment.
Charge-transfer excitations are also visible in L-edge RIXS. Remember that in
discussing L-edge or Kβ features with the charge-transfer model, the ground state
was written as a configuration interaction between a purely ionic configuration and a
configuration with an electron transferred from the ligand: α3d
8 + β3d
9 L (Fig. 8.17).
Fig. 8.16 Top left: schematic representation of K-L RIXS. Top right: a RIXS plane for high-spin
Ni(II) in NiF 2 . Bottom left: conventional K pre-edge absorption spectra (red dashed line) and RIXS
constant final-state energy plots (black solid line). Bottom right: conventional L absorption spectra
(red dashed line) compared to RIXS line plots (black solid line) [361]
208
8 Photon-in Photon-out Spectroscopy