

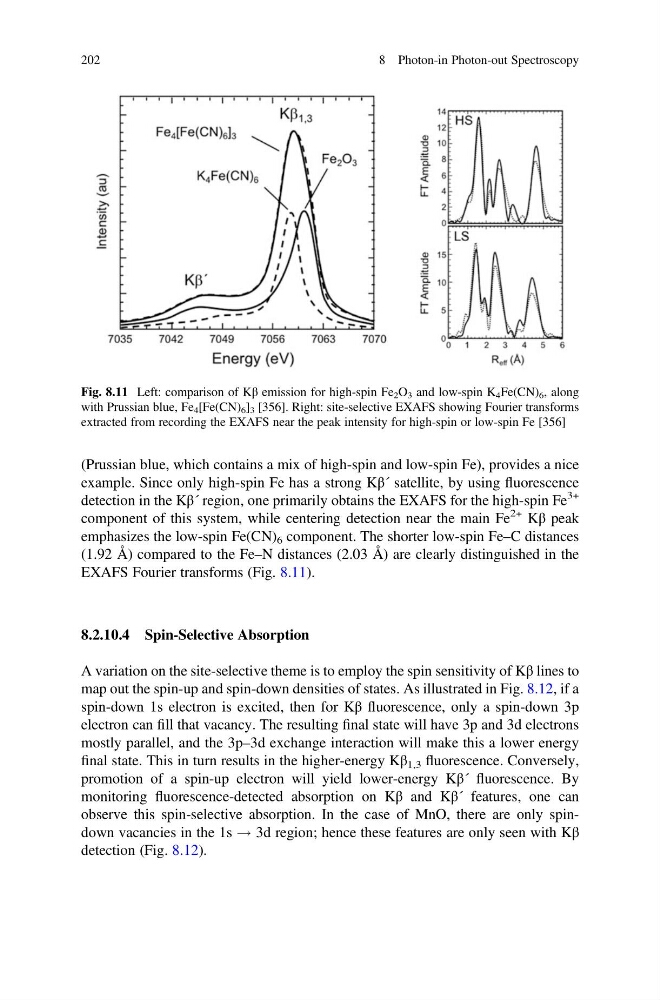
(Prussian blue, which contains a mix of high-spin and low-spin Fe), provides a nice
example. Since only high-spin Fe has a strong Kβ´ satellite, by using fluorescence
detection in the Kβ´ region, one primarily obtains the EXAFS for the high-spin Fe
3+
component of this system, while centering detection near the main Fe
2+ Kβ peak
emphasizes the low-spin Fe(CN) 6 component. The shorter low-spin Fe–C distances
(1.92 Å) compared to the Fe–N distances (2.03 Å) are clearly distinguished in the
EXAFS Fourier transforms (Fig. 8.11).
8.2.10.4 Spin-Selective Absorption
A variation on the site-selective theme is to employ the spin sensitivity of Kβ lines to
map out the spin-up and spin-down densities of states. As illustrated in Fig. 8.12, if a
spin-down 1s electron is excited, then for Kβ fluorescence, only a spin-down 3p
electron can fill that vacancy. The resulting final state will have 3p and 3d electrons
mostly parallel, and the 3p–3d exchange interaction will make this a lower energy
final state. This in turn results in the higher-energy Kβ 1,3 fluorescence. Conversely,
promotion of a spin-up electron will yield lower-energy Kβ´ fluorescence. By
monitoring fluorescence-detected absorption on Kβ and Kβ´ features, one can
observe this spin-selective absorption. In the case of MnO, there are only spindown vacancies in the 1s ! 3d region; hence these features are only seen with Kβ
detection (Fig. 8.12).
Fig. 8.11 Left: comparison of Kβ emission for high-spin Fe 2 O 3 and low-spin K 4 Fe(CN) 6 , along
with Prussian blue, Fe 4 [Fe(CN) 6 ] 3 [356]. Right: site-selective EXAFS showing Fourier transforms
extracted from recording the EXAFS near the peak intensity for high-spin or low-spin Fe [356]
202
8 Photon-in Photon-out Spectroscopy
example. Since only high-spin Fe has a strong Kβ´ satellite, by using fluorescence
detection in the Kβ´ region, one primarily obtains the EXAFS for the high-spin Fe
3+
component of this system, while centering detection near the main Fe
2+ Kβ peak
emphasizes the low-spin Fe(CN) 6 component. The shorter low-spin Fe–C distances
(1.92 Å) compared to the Fe–N distances (2.03 Å) are clearly distinguished in the
EXAFS Fourier transforms (Fig. 8.11).
8.2.10.4 Spin-Selective Absorption
A variation on the site-selective theme is to employ the spin sensitivity of Kβ lines to
map out the spin-up and spin-down densities of states. As illustrated in Fig. 8.12, if a
spin-down 1s electron is excited, then for Kβ fluorescence, only a spin-down 3p
electron can fill that vacancy. The resulting final state will have 3p and 3d electrons
mostly parallel, and the 3p–3d exchange interaction will make this a lower energy
final state. This in turn results in the higher-energy Kβ 1,3 fluorescence. Conversely,
promotion of a spin-up electron will yield lower-energy Kβ´ fluorescence. By
monitoring fluorescence-detected absorption on Kβ and Kβ´ features, one can
observe this spin-selective absorption. In the case of MnO, there are only spindown vacancies in the 1s ! 3d region; hence these features are only seen with Kβ
detection (Fig. 8.12).
Fig. 8.11 Left: comparison of Kβ emission for high-spin Fe 2 O 3 and low-spin K 4 Fe(CN) 6 , along
with Prussian blue, Fe 4 [Fe(CN) 6 ] 3 [356]. Right: site-selective EXAFS showing Fourier transforms
extracted from recording the EXAFS near the peak intensity for high-spin or low-spin Fe [356]
202
8 Photon-in Photon-out Spectroscopy