

orbitals, 1s ! 4a 1 and 1s ! 2b 2 , both of which involve antibonding orbitals pointing
at the H atoms. In the liquid phase, a single pre-edge feature is observed, and it is
argued that the intensity of this feature is related to the number of broken or
weakened H-bonds. As expected, as the temperature of water increases, the intensity
of this pre-edge feature also increases, while the post-edge intensity decreases
(Fig. 7.6).
Based in part on X-ray absorption data, but also involving X-ray emission [277]
and X-ray Raman studies [278], a two-phase model for water has been proposed
[276]. In this description, most water molecules have strongly distorted hydrogen
bonds, leading to denser structures (HDW), while other waters exist in tetrahedrally
bonded patches that exist as low-density local fluctuations (LDW). From the same
data, others have dismissed the two-phase model, arguing that “X-ray spectra of
liquid water in ambient conditions can be understood without a two-structure model”
and favoring a continuous distribution model with ~1.7 donated H-bonds per
molecule [279]. More than 100 X-ray papers have addressed the pros and cons of
different water models. Experts have argued about liquid water for more than a
century, so it is clearly beyond the scope of this chapter to settle this controversy.
7.5.2 Band Structure Approaches
In going from molecules to solids, the multiple-scattering approach can be continued
by conducting DFT or FMS on a fragment of the solid-state structure that is large
enough to capture the chemistry and electronic structure of the solid. Alternatively,
the analysis can be done in “reciprocal space” via band structure calculations.
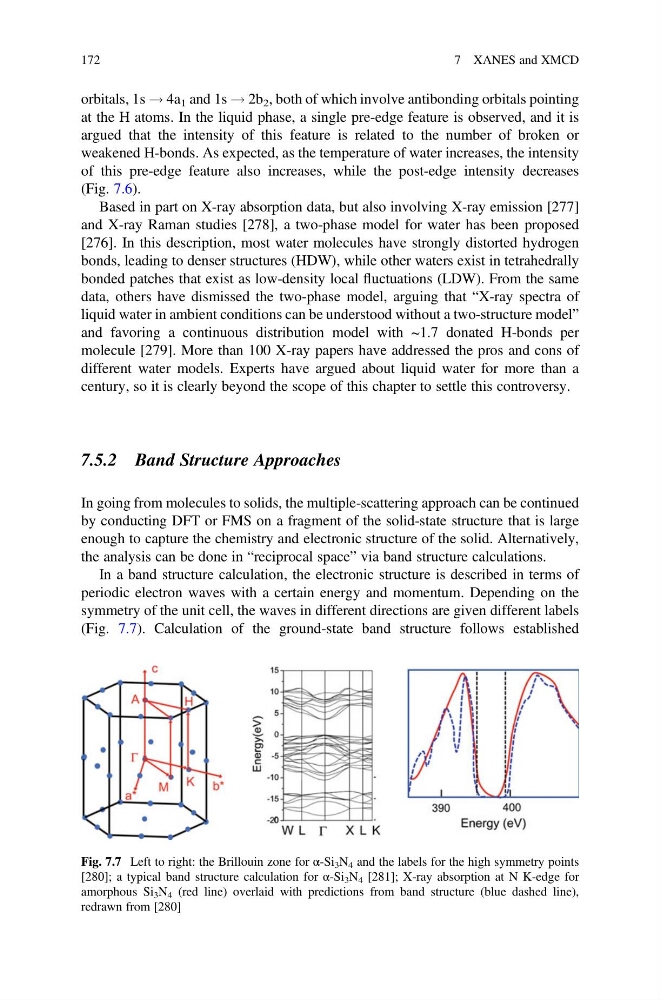
In a band structure calculation, the electronic structure is described in terms of
periodic electron waves with a certain energy and momentum. Depending on the
symmetry of the unit cell, the waves in different directions are given different labels
(Fig. 7.7). Calculation of the ground-state band structure follows established
Fig. 7.7 Left to right: the Brillouin zone for α-Si 3 N 4 and the labels for the high symmetry points
[280]; a typical band structure calculation for α-Si 3 N 4 [281]; X-ray absorption at N K-edge for
amorphous Si 3 N 4 (red line) overlaid with predictions from band structure (blue dashed line),
redrawn from [280]
172
7 XANES and XMCD
at the H atoms. In the liquid phase, a single pre-edge feature is observed, and it is
argued that the intensity of this feature is related to the number of broken or
weakened H-bonds. As expected, as the temperature of water increases, the intensity
of this pre-edge feature also increases, while the post-edge intensity decreases
(Fig. 7.6).
Based in part on X-ray absorption data, but also involving X-ray emission [277]
and X-ray Raman studies [278], a two-phase model for water has been proposed
[276]. In this description, most water molecules have strongly distorted hydrogen
bonds, leading to denser structures (HDW), while other waters exist in tetrahedrally
bonded patches that exist as low-density local fluctuations (LDW). From the same
data, others have dismissed the two-phase model, arguing that “X-ray spectra of
liquid water in ambient conditions can be understood without a two-structure model”
and favoring a continuous distribution model with ~1.7 donated H-bonds per
molecule [279]. More than 100 X-ray papers have addressed the pros and cons of
different water models. Experts have argued about liquid water for more than a
century, so it is clearly beyond the scope of this chapter to settle this controversy.
7.5.2 Band Structure Approaches
In going from molecules to solids, the multiple-scattering approach can be continued
by conducting DFT or FMS on a fragment of the solid-state structure that is large
enough to capture the chemistry and electronic structure of the solid. Alternatively,
the analysis can be done in “reciprocal space” via band structure calculations.
In a band structure calculation, the electronic structure is described in terms of
periodic electron waves with a certain energy and momentum. Depending on the
symmetry of the unit cell, the waves in different directions are given different labels
(Fig. 7.7). Calculation of the ground-state band structure follows established
Fig. 7.7 Left to right: the Brillouin zone for α-Si 3 N 4 and the labels for the high symmetry points
[280]; a typical band structure calculation for α-Si 3 N 4 [281]; X-ray absorption at N K-edge for
amorphous Si 3 N 4 (red line) overlaid with predictions from band structure (blue dashed line),
redrawn from [280]
172
7 XANES and XMCD