

Most experiments take advantage of the fact that scattering of the Auger electron
and photoelectron following X-ray absorption and relaxation results in a cascade of
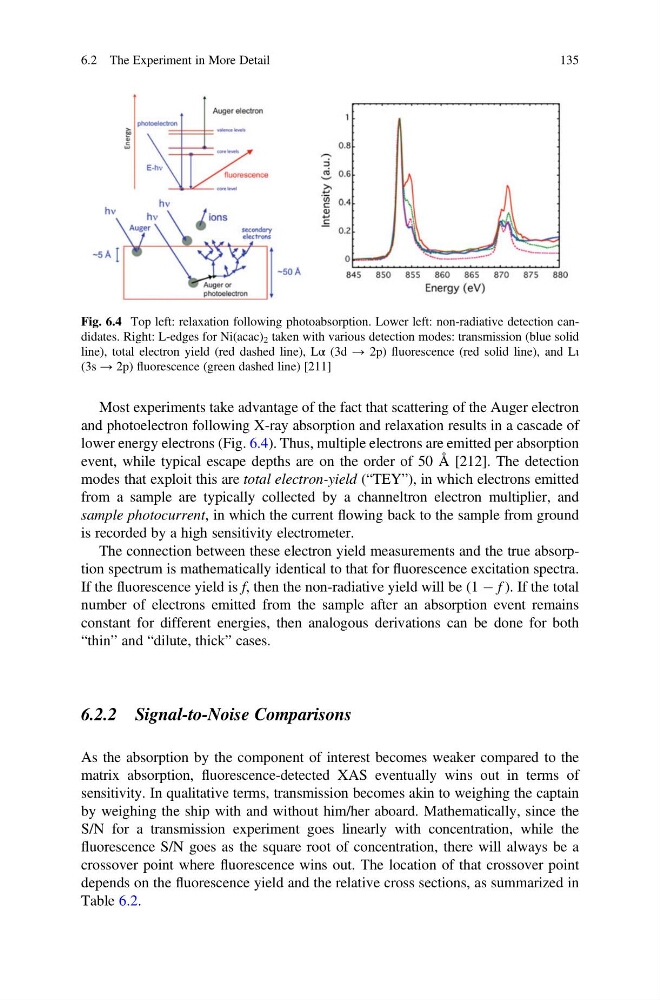
lower energy electrons (Fig. 6.4). Thus, multiple electrons are emitted per absorption
event, while typical escape depths are on the order of 50 Å [212]. The detection
modes that exploit this are total electron-yield (“TEY”), in which electrons emitted
from a sample are typically collected by a channeltron electron multiplier, and
sample photocurrent, in which the current flowing back to the sample from ground
is recorded by a high sensitivity electrometer.
The connection between these electron yield measurements and the true absorption spectrum is mathematically identical to that for fluorescence excitation spectra.
If the fluorescence yield is f, then the non-radiative yield will be (1 À f ). If the total
number of electrons emitted from the sample after an absorption event remains
constant for different energies, then analogous derivations can be done for both
“thin” and “dilute, thick” cases.
6.2.2 Signal-to-Noise Comparisons
As the absorption by the component of interest becomes weaker compared to the
matrix absorption, fluorescence-detected XAS eventually wins out in terms of
sensitivity. In qualitative terms, transmission becomes akin to weighing the captain
by weighing the ship with and without him/her aboard. Mathematically, since the
S/N for a transmission experiment goes linearly with concentration, while the
fluorescence S/N goes as the square root of concentration, there will always be a
crossover point where fluorescence wins out. The location of that crossover point
depends on the fluorescence yield and the relative cross sections, as summarized in
Table 6.2.
Fig. 6.4 Top left: relaxation following photoabsorption. Lower left: non-radiative detection candidates. Right: L-edges for Ni(acac) 2 taken with various detection modes: transmission (blue solid
line), total electron yield (red dashed line), Lα (3d → 2p) fluorescence (red solid line), and Lι
(3s → 2p) fluorescence (green dashed line) [211]
6.2 The Experiment in More Detail
135
and photoelectron following X-ray absorption and relaxation results in a cascade of
lower energy electrons (Fig. 6.4). Thus, multiple electrons are emitted per absorption
event, while typical escape depths are on the order of 50 Å [212]. The detection
modes that exploit this are total electron-yield (“TEY”), in which electrons emitted
from a sample are typically collected by a channeltron electron multiplier, and
sample photocurrent, in which the current flowing back to the sample from ground
is recorded by a high sensitivity electrometer.
The connection between these electron yield measurements and the true absorption spectrum is mathematically identical to that for fluorescence excitation spectra.
If the fluorescence yield is f, then the non-radiative yield will be (1 À f ). If the total
number of electrons emitted from the sample after an absorption event remains
constant for different energies, then analogous derivations can be done for both
“thin” and “dilute, thick” cases.
6.2.2 Signal-to-Noise Comparisons
As the absorption by the component of interest becomes weaker compared to the
matrix absorption, fluorescence-detected XAS eventually wins out in terms of
sensitivity. In qualitative terms, transmission becomes akin to weighing the captain
by weighing the ship with and without him/her aboard. Mathematically, since the
S/N for a transmission experiment goes linearly with concentration, while the
fluorescence S/N goes as the square root of concentration, there will always be a
crossover point where fluorescence wins out. The location of that crossover point
depends on the fluorescence yield and the relative cross sections, as summarized in
Table 6.2.
Fig. 6.4 Top left: relaxation following photoabsorption. Lower left: non-radiative detection candidates. Right: L-edges for Ni(acac) 2 taken with various detection modes: transmission (blue solid
line), total electron yield (red dashed line), Lα (3d → 2p) fluorescence (red solid line), and Lι
(3s → 2p) fluorescence (green dashed line) [211]
6.2 The Experiment in More Detail
135