

If X-ray absorption is so wonderful, why doesn’t everyone have an X-ray
spectrometer in their lab? The primary difficulty is obtaining an intense, monochromatic, and tunable source of X-rays. The advent of broadband, collimated synchrotron radiation sources was a major breakthrough for X-ray absorption spectroscopy;
to use a term that is overworked but still true, it was a revolution.
6.2 The Experiment in More Detail
6.2.1 Detection Modes
There are three common modes for recording an X-ray absorption spectrum: transmission, fluorescence, and electron yield. The transmission measurement is similar
to the way one normally records a UV-visible spectrum. One difference is the
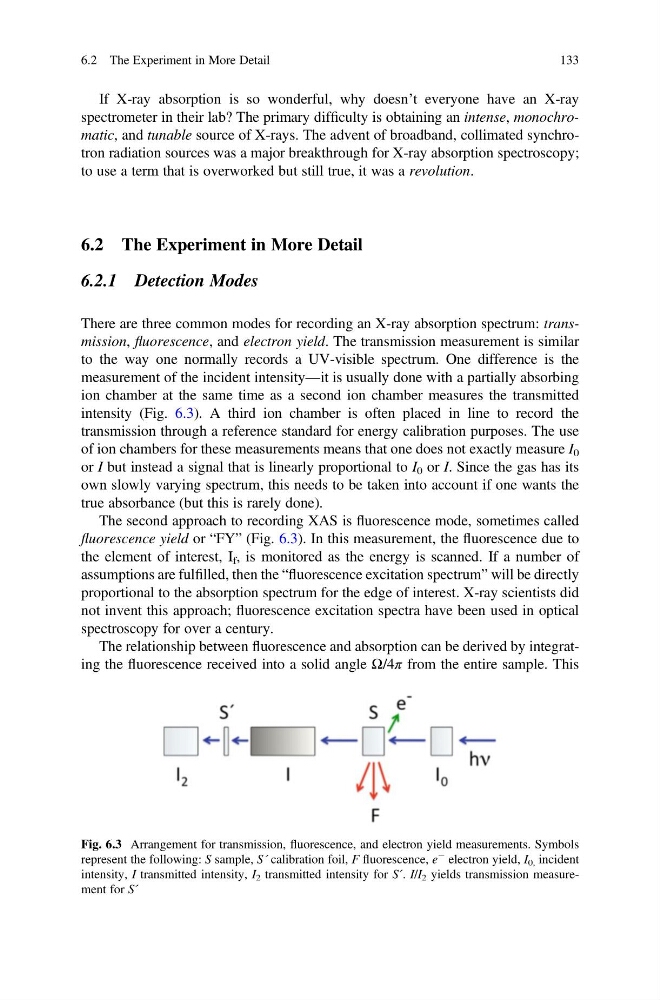
measurement of the incident intensity—it is usually done with a partially absorbing
ion chamber at the same time as a second ion chamber measures the transmitted
intensity (Fig. 6.3). A third ion chamber is often placed in line to record the
transmission through a reference standard for energy calibration purposes. The use
of ion chambers for these measurements means that one does not exactly measure I 0
or I but instead a signal that is linearly proportional to I 0 or I. Since the gas has its
own slowly varying spectrum, this needs to be taken into account if one wants the
true absorbance (but this is rarely done).
The second approach to recording XAS is fluorescence mode, sometimes called
fluorescence yield or “FY” (Fig. 6.3). In this measurement, the fluorescence due to
the element of interest, I f , is monitored as the energy is scanned. If a number of
assumptions are fulfilled, then the “fluorescence excitation spectrum” will be directly
proportional to the absorption spectrum for the edge of interest. X-ray scientists did
not invent this approach; fluorescence excitation spectra have been used in optical
spectroscopy for over a century.
The relationship between fluorescence and absorption can be derived by integrating the fluorescence received into a solid angle Ω/4π from the entire sample. This
Fig. 6.3 Arrangement for transmission, fluorescence, and electron yield measurements. Symbols
represent the following: S sample, S´ calibration foil, F fluorescence, e
À electron yield, I 0, incident
intensity, I transmitted intensity, I 2 transmitted intensity for S´. I/I 2 yields transmission measurement for S´
6.2 The Experiment in More Detail
133
spectrometer in their lab? The primary difficulty is obtaining an intense, monochromatic, and tunable source of X-rays. The advent of broadband, collimated synchrotron radiation sources was a major breakthrough for X-ray absorption spectroscopy;
to use a term that is overworked but still true, it was a revolution.
6.2 The Experiment in More Detail
6.2.1 Detection Modes
There are three common modes for recording an X-ray absorption spectrum: transmission, fluorescence, and electron yield. The transmission measurement is similar
to the way one normally records a UV-visible spectrum. One difference is the
measurement of the incident intensity—it is usually done with a partially absorbing
ion chamber at the same time as a second ion chamber measures the transmitted
intensity (Fig. 6.3). A third ion chamber is often placed in line to record the
transmission through a reference standard for energy calibration purposes. The use
of ion chambers for these measurements means that one does not exactly measure I 0
or I but instead a signal that is linearly proportional to I 0 or I. Since the gas has its
own slowly varying spectrum, this needs to be taken into account if one wants the
true absorbance (but this is rarely done).
The second approach to recording XAS is fluorescence mode, sometimes called
fluorescence yield or “FY” (Fig. 6.3). In this measurement, the fluorescence due to
the element of interest, I f , is monitored as the energy is scanned. If a number of
assumptions are fulfilled, then the “fluorescence excitation spectrum” will be directly
proportional to the absorption spectrum for the edge of interest. X-ray scientists did
not invent this approach; fluorescence excitation spectra have been used in optical
spectroscopy for over a century.
The relationship between fluorescence and absorption can be derived by integrating the fluorescence received into a solid angle Ω/4π from the entire sample. This
Fig. 6.3 Arrangement for transmission, fluorescence, and electron yield measurements. Symbols
represent the following: S sample, S´ calibration foil, F fluorescence, e
À electron yield, I 0, incident
intensity, I transmitted intensity, I 2 transmitted intensity for S´. I/I 2 yields transmission measurement for S´
6.2 The Experiment in More Detail
133