

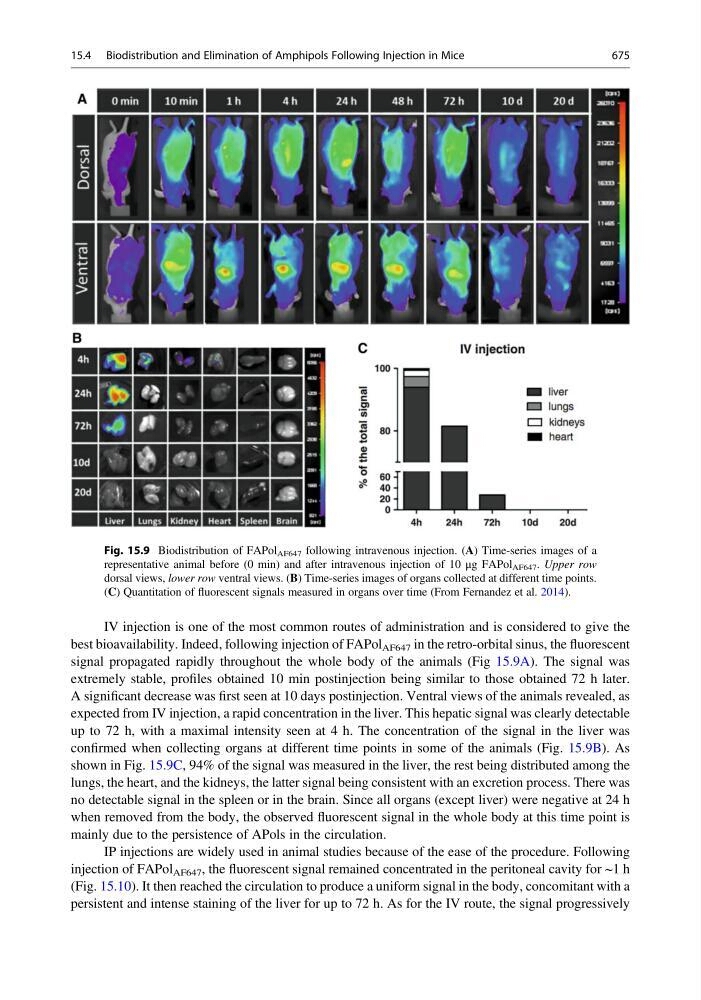
IV injection is one of the most common routes of administration and is considered to give the
best bioavailability. Indeed, following injection of FAPol AF647 in the retro-orbital sinus, the fluorescent
signal propagated rapidly throughout the whole body of the animals (Fig 15.9A). The signal was
extremely stable, profiles obtained 10 min postinjection being similar to those obtained 72 h later.
A significant decrease was first seen at 10 days postinjection. Ventral views of the animals revealed, as
expected from IV injection, a rapid concentration in the liver. This hepatic signal was clearly detectable
up to 72 h, with a maximal intensity seen at 4 h. The concentration of the signal in the liver was
confirmed when collecting organs at different time points in some of the animals (Fig. 15.9B). As
shown in Fig. 15.9C, 94% of the signal was measured in the liver, the rest being distributed among the
lungs, the heart, and the kidneys, the latter signal being consistent with an excretion process. There was
no detectable signal in the spleen or in the brain. Since all organs (except liver) were negative at 24 h
when removed from the body, the observed fluorescent signal in the whole body at this time point is
mainly due to the persistence of APols in the circulation.
IP injections are widely used in animal studies because of the ease of the procedure. Following
injection of FAPol AF647 , the fluorescent signal remained concentrated in the peritoneal cavity for ~1 h
(Fig. 15.10). It then reached the circulation to produce a uniform signal in the body, concomitant with a
persistent and intense staining of the liver for up to 72 h. As for the IV route, the signal progressively
Fig. 15.9 Biodistribution of FAPol AF647 following intravenous injection. (A) Time-series images of a
representative animal before (0 min) and after intravenous injection of 10 μg FAPol AF647 . Upper row
dorsal views, lower row ventral views. (B) Time-series images of organs collected at different time points.
(C) Quantitation of fluorescent signals measured in organs over time (From Fernandez et al. 2014).
15.4 Biodistribution and Elimination of Amphipols Following Injection in Mice
675