

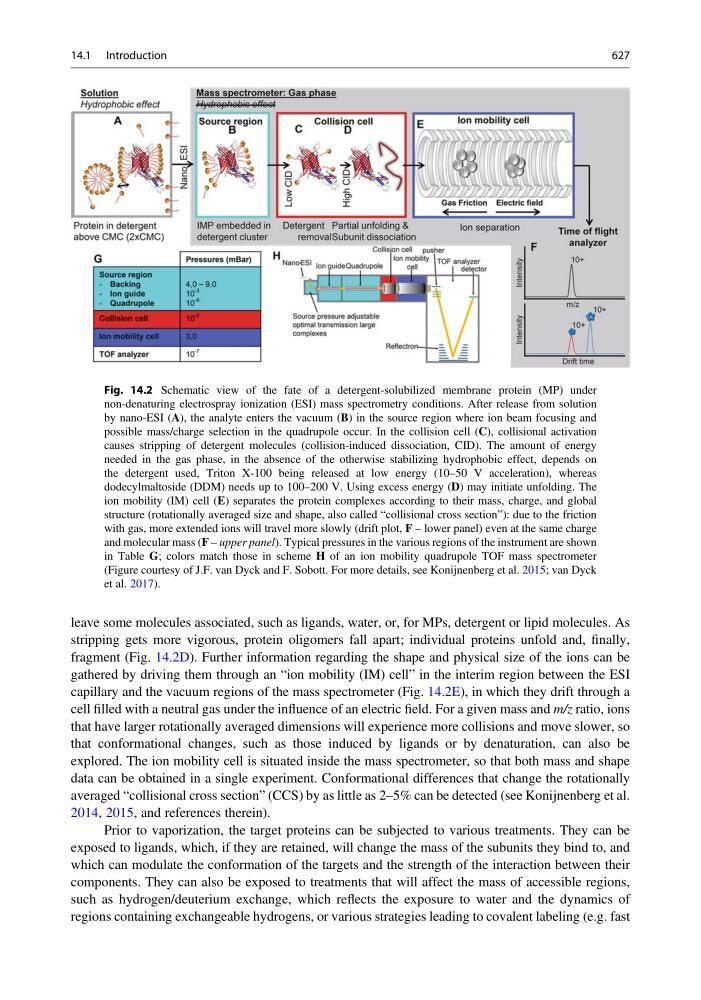
leave some molecules associated, such as ligands, water, or, for MPs, detergent or lipid molecules. As
stripping gets more vigorous, protein oligomers fall apart; individual proteins unfold and, finally,
fragment (Fig. 14.2D). Further information regarding the shape and physical size of the ions can be
gathered by driving them through an “ion mobility (IM) cell” in the interim region between the ESI
capillary and the vacuum regions of the mass spectrometer (Fig. 14.2E), in which they drift through a
cell filled with a neutral gas under the influence of an electric field. For a given mass and m/z ratio, ions
that have larger rotationally averaged dimensions will experience more collisions and move slower, so
that conformational changes, such as those induced by ligands or by denaturation, can also be
explored. The ion mobility cell is situated inside the mass spectrometer, so that both mass and shape
data can be obtained in a single experiment. Conformational differences that change the rotationally
averaged “collisional cross section” (CCS) by as little as 2–5% can be detected (see Konijnenberg et al.
2014, 2015, and references therein).
Prior to vaporization, the target proteins can be subjected to various treatments. They can be
exposed to ligands, which, if they are retained, will change the mass of the subunits they bind to, and
which can modulate the conformation of the targets and the strength of the interaction between their
components. They can also be exposed to treatments that will affect the mass of accessible regions,
such as hydrogen/deuterium exchange, which reflects the exposure to water and the dynamics of
regions containing exchangeable hydrogens, or various strategies leading to covalent labeling (e.g. fast
Fig. 14.2 Schematic view of the fate of a detergent-solubilized membrane protein (MP) under
non-denaturing electrospray ionization (ESI) mass spectrometry conditions. After release from solution
by nano-ESI (A), the analyte enters the vacuum (B) in the source region where ion beam focusing and
possible mass/charge selection in the quadrupole occur. In the collision cell (C), collisional activation
causes stripping of detergent molecules (collision-induced dissociation, CID). The amount of energy
needed in the gas phase, in the absence of the otherwise stabilizing hydrophobic effect, depends on
the detergent used, Triton X-100 being released at low energy (10–50 V acceleration), whereas
dodecylmaltoside (DDM) needs up to 100–200 V. Using excess energy (D) may initiate unfolding. The
ion mobility (IM) cell (E) separates the protein complexes according to their mass, charge, and global
structure (rotationally averaged size and shape, also called “collisional cross section”): due to the friction
with gas, more extended ions will travel more slowly (drift plot, F – lower panel) even at the same charge
and molecular mass (F – upper panel). Typical pressures in the various regions of the instrument are shown
in Table G; colors match those in scheme H of an ion mobility quadrupole TOF mass spectrometer
(Figure courtesy of J.F. van Dyck and F. Sobott. For more details, see Konijnenberg et al. 2015; van Dyck
et al. 2017).
14.1 Introduction
627