

counting mode so as to achieve higher signal-to-noise ratios at the lower spatial frequencies, which are
crucial for particle alignment, and with statistical image classification and movie processing, this
approach produced a markedly improved map with an overall resolution of 4.5 Å (Fig. 12.24C, D)
(Lu et al. 2014; Bai et al. 2015b, c). Nineteen α-helices were identified in the TM region. However, in
contrast to the density for the TM helices, that for the connecting sequences between neighboring
helices was often weak or absent. Only seven TM helices appeared to be connected by strong density,
suggesting their order of linkage.
In a subsequent work (Sun et al. 2015), T4 lysozyme was fused to the N-terminus of one of the
subunits, presenilin-1, and imaging carried out in digitonin. The resolution of the complex as a whole was
only marginally better than that achieved in the first study (4.32 Å instead of 4.5), but that of the TM
region improved sufficiently for all connections between TM α-helices to be convincingly identified. The
structures obtained in A8-35 and in digitonin are nearly identical. It would be interesting to sort out
exactly what, in the differences between the two structures, is due to the use of a different surfactant and
what to the fusion with T4 lysozyme. These two studies offer, in any case, a reminder that a surfactant
that is inadequate to study a given target can prove to be effective for another, very similar one. The study
in A8-35 was pushed to 3.4-Å resolution (Bai et al. 2015c), permitting atomic modeling of the side
chains, and extended to an inhibitor-bound form (Bai et al. 2015b).
Cryo-EM Study 12.21 (Paulsen et al. 2015) bore on APol-trapped TRPA1, the same receptor that
had been examined in negative stain in Study 12.4 in complex with A8-35 (Cvetkov et al. 2011; Huynh
et al. 2014b). Maltose-binding protein-tagged human TRPA1 was expressed in HEK cells and
solubilized and purified using MNG-3 as the detergent. For cryo-EM, MNG-3 was exchanged for
PMAL-C8, an APol that is zwitterionic at the pH (8.0) used in these experiments (Gorzelle et al. 2002;
Nagy et al. 2001; see Chap. 4), using Bio-Beads followed by SEC. They were vitrified on holey carbon
grids in the presence of either an agonist or one of two antagonists and imaged using a microscope
equipped with a K2 Summit direct-electron detector camera operated in counting mode, each image
being fractionated into 30 subframes. The final resolutions of the three reconstructions were estimated,
according to the FSC ¼ 0.143 criterion, to be 4.24, 3.9, and 4.7 Å, respectively (Paulsen et al. 2015).
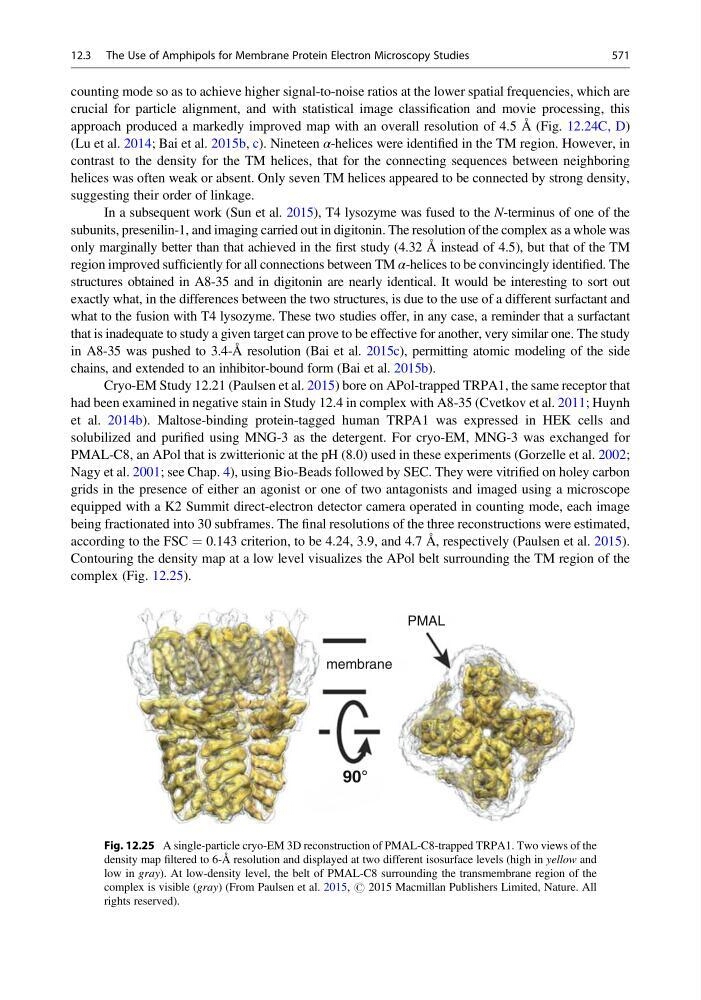
Contouring the density map at a low level visualizes the APol belt surrounding the TM region of the
complex (Fig. 12.25).
PMAL
membrane
90°
Fig. 12.25 A single-particle cryo-EM 3D reconstruction of PMAL-C8-trapped TRPA1. Two views of the
density map filtered to 6-Å resolution and displayed at two different isosurface levels (high in yellow and
low in gray). At low-density level, the belt of PMAL-C8 surrounding the transmembrane region of the
complex is visible (gray) (From Paulsen et al. 2015, # 2015 Macmillan Publishers Limited, Nature. All
rights reserved).
12.3 The Use of Amphipols for Membrane Protein Electron Microscopy Studies
571
crucial for particle alignment, and with statistical image classification and movie processing, this
approach produced a markedly improved map with an overall resolution of 4.5 Å (Fig. 12.24C, D)
(Lu et al. 2014; Bai et al. 2015b, c). Nineteen α-helices were identified in the TM region. However, in
contrast to the density for the TM helices, that for the connecting sequences between neighboring
helices was often weak or absent. Only seven TM helices appeared to be connected by strong density,
suggesting their order of linkage.
In a subsequent work (Sun et al. 2015), T4 lysozyme was fused to the N-terminus of one of the
subunits, presenilin-1, and imaging carried out in digitonin. The resolution of the complex as a whole was
only marginally better than that achieved in the first study (4.32 Å instead of 4.5), but that of the TM
region improved sufficiently for all connections between TM α-helices to be convincingly identified. The
structures obtained in A8-35 and in digitonin are nearly identical. It would be interesting to sort out
exactly what, in the differences between the two structures, is due to the use of a different surfactant and
what to the fusion with T4 lysozyme. These two studies offer, in any case, a reminder that a surfactant
that is inadequate to study a given target can prove to be effective for another, very similar one. The study
in A8-35 was pushed to 3.4-Å resolution (Bai et al. 2015c), permitting atomic modeling of the side
chains, and extended to an inhibitor-bound form (Bai et al. 2015b).
Cryo-EM Study 12.21 (Paulsen et al. 2015) bore on APol-trapped TRPA1, the same receptor that
had been examined in negative stain in Study 12.4 in complex with A8-35 (Cvetkov et al. 2011; Huynh
et al. 2014b). Maltose-binding protein-tagged human TRPA1 was expressed in HEK cells and
solubilized and purified using MNG-3 as the detergent. For cryo-EM, MNG-3 was exchanged for
PMAL-C8, an APol that is zwitterionic at the pH (8.0) used in these experiments (Gorzelle et al. 2002;
Nagy et al. 2001; see Chap. 4), using Bio-Beads followed by SEC. They were vitrified on holey carbon
grids in the presence of either an agonist or one of two antagonists and imaged using a microscope
equipped with a K2 Summit direct-electron detector camera operated in counting mode, each image
being fractionated into 30 subframes. The final resolutions of the three reconstructions were estimated,
according to the FSC ¼ 0.143 criterion, to be 4.24, 3.9, and 4.7 Å, respectively (Paulsen et al. 2015).
Contouring the density map at a low level visualizes the APol belt surrounding the TM region of the
complex (Fig. 12.25).
PMAL
membrane
90°
Fig. 12.25 A single-particle cryo-EM 3D reconstruction of PMAL-C8-trapped TRPA1. Two views of the
density map filtered to 6-Å resolution and displayed at two different isosurface levels (high in yellow and
low in gray). At low-density level, the belt of PMAL-C8 surrounding the transmembrane region of the
complex is visible (gray) (From Paulsen et al. 2015, # 2015 Macmillan Publishers Limited, Nature. All
rights reserved).
12.3 The Use of Amphipols for Membrane Protein Electron Microscopy Studies
571