

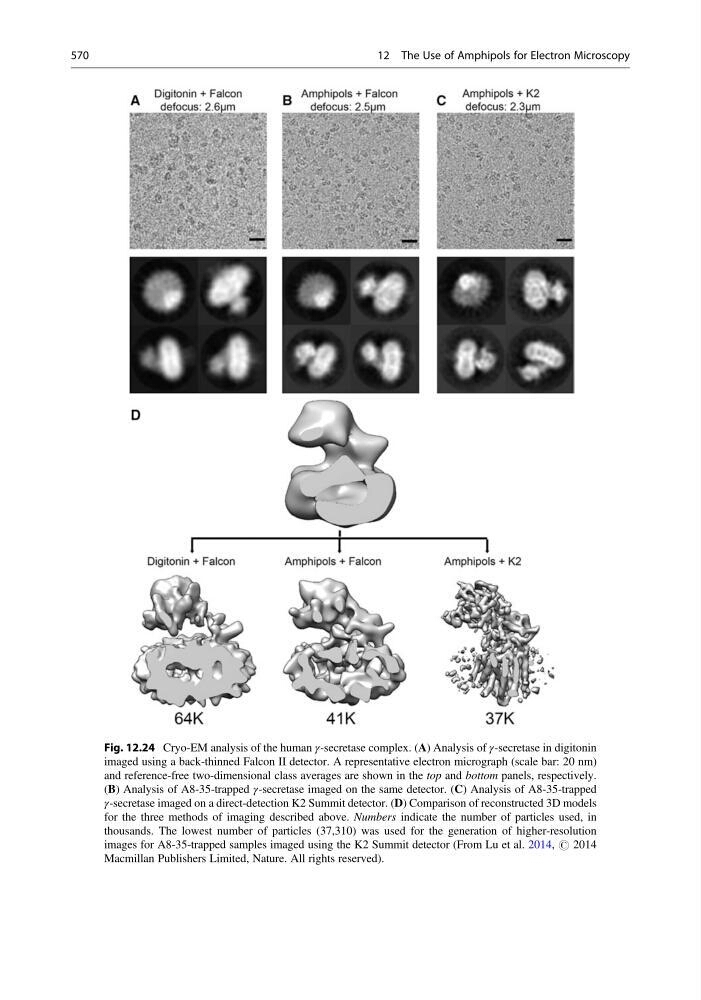
Fig. 12.24 Cryo-EM analysis of the human γ-secretase complex. (A) Analysis of γ-secretase in digitonin
imaged using a back-thinned Falcon II detector. A representative electron micrograph (scale bar: 20 nm)
and reference-free two-dimensional class averages are shown in the top and bottom panels, respectively.
(B) Analysis of A8-35-trapped γ-secretase imaged on the same detector. (C) Analysis of A8-35-trapped
γ-secretase imaged on a direct-detection K2 Summit detector. (D) Comparison of reconstructed 3D models
for the three methods of imaging described above. Numbers indicate the number of particles used, in
thousands. The lowest number of particles (37,310) was used for the generation of higher-resolution
images for A8-35-trapped samples imaged using the K2 Summit detector (From Lu et al. 2014, # 2014
Macmillan Publishers Limited, Nature. All rights reserved).
570
12 The Use of Amphipols for Electron Microscopy
imaged using a back-thinned Falcon II detector. A representative electron micrograph (scale bar: 20 nm)
and reference-free two-dimensional class averages are shown in the top and bottom panels, respectively.
(B) Analysis of A8-35-trapped γ-secretase imaged on the same detector. (C) Analysis of A8-35-trapped
γ-secretase imaged on a direct-detection K2 Summit detector. (D) Comparison of reconstructed 3D models
for the three methods of imaging described above. Numbers indicate the number of particles used, in
thousands. The lowest number of particles (37,310) was used for the generation of higher-resolution
images for A8-35-trapped samples imaged using the K2 Summit detector (From Lu et al. 2014, # 2014
Macmillan Publishers Limited, Nature. All rights reserved).
570
12 The Use of Amphipols for Electron Microscopy