

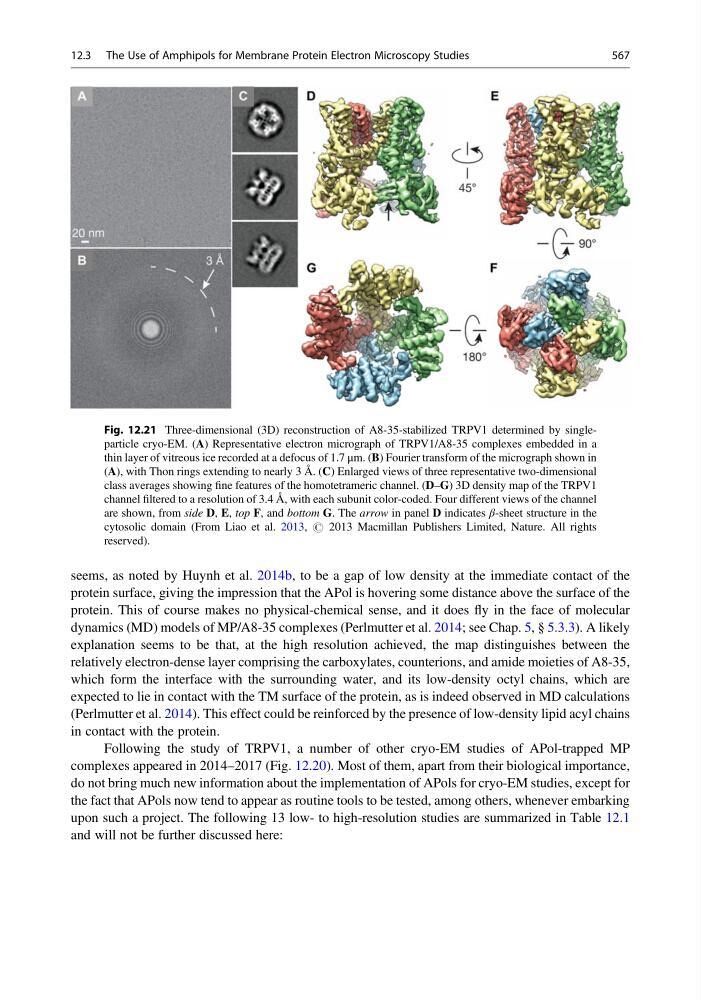
seems, as noted by Huynh et al. 2014b, to be a gap of low density at the immediate contact of the
protein surface, giving the impression that the APol is hovering some distance above the surface of the
protein. This of course makes no physical-chemical sense, and it does fly in the face of molecular
dynamics (MD) models of MP/A8-35 complexes (Perlmutter et al. 2014; see Chap. 5, § 5.3.3). A likely
explanation seems to be that, at the high resolution achieved, the map distinguishes between the
relatively electron-dense layer comprising the carboxylates, counterions, and amide moieties of A8-35,
which form the interface with the surrounding water, and its low-density octyl chains, which are
expected to lie in contact with the TM surface of the protein, as is indeed observed in MD calculations
(Perlmutter et al. 2014). This effect could be reinforced by the presence of low-density lipid acyl chains
in contact with the protein.
Following the study of TRPV1, a number of other cryo-EM studies of APol-trapped MP
complexes appeared in 2014–2017 (Fig. 12.20). Most of them, apart from their biological importance,
do not bring much new information about the implementation of APols for cryo-EM studies, except for
the fact that APols now tend to appear as routine tools to be tested, among others, whenever embarking
upon such a project. The following 13 low- to high-resolution studies are summarized in Table 12.1
and will not be further discussed here:
Fig. 12.21 Three-dimensional (3D) reconstruction of A8-35-stabilized TRPV1 determined by singleparticle cryo-EM. (A) Representative electron micrograph of TRPV1/A8-35 complexes embedded in a
thin layer of vitreous ice recorded at a defocus of 1.7 μm. (B) Fourier transform of the micrograph shown in
(A), with Thon rings extending to nearly 3 Å. (C) Enlarged views of three representative two-dimensional
class averages showing fine features of the homotetrameric channel. (D–G) 3D density map of the TRPV1
channel filtered to a resolution of 3.4 Å, with each subunit color-coded. Four different views of the channel
are shown, from side D, E, top F, and bottom G. The arrow in panel D indicates β-sheet structure in the
cytosolic domain (From Liao et al. 2013, # 2013 Macmillan Publishers Limited, Nature. All rights
reserved).
12.3 The Use of Amphipols for Membrane Protein Electron Microscopy Studies
567
protein surface, giving the impression that the APol is hovering some distance above the surface of the
protein. This of course makes no physical-chemical sense, and it does fly in the face of molecular
dynamics (MD) models of MP/A8-35 complexes (Perlmutter et al. 2014; see Chap. 5, § 5.3.3). A likely
explanation seems to be that, at the high resolution achieved, the map distinguishes between the
relatively electron-dense layer comprising the carboxylates, counterions, and amide moieties of A8-35,
which form the interface with the surrounding water, and its low-density octyl chains, which are
expected to lie in contact with the TM surface of the protein, as is indeed observed in MD calculations
(Perlmutter et al. 2014). This effect could be reinforced by the presence of low-density lipid acyl chains
in contact with the protein.
Following the study of TRPV1, a number of other cryo-EM studies of APol-trapped MP
complexes appeared in 2014–2017 (Fig. 12.20). Most of them, apart from their biological importance,
do not bring much new information about the implementation of APols for cryo-EM studies, except for
the fact that APols now tend to appear as routine tools to be tested, among others, whenever embarking
upon such a project. The following 13 low- to high-resolution studies are summarized in Table 12.1
and will not be further discussed here:
Fig. 12.21 Three-dimensional (3D) reconstruction of A8-35-stabilized TRPV1 determined by singleparticle cryo-EM. (A) Representative electron micrograph of TRPV1/A8-35 complexes embedded in a
thin layer of vitreous ice recorded at a defocus of 1.7 μm. (B) Fourier transform of the micrograph shown in
(A), with Thon rings extending to nearly 3 Å. (C) Enlarged views of three representative two-dimensional
class averages showing fine features of the homotetrameric channel. (D–G) 3D density map of the TRPV1
channel filtered to a resolution of 3.4 Å, with each subunit color-coded. Four different views of the channel
are shown, from side D, E, top F, and bottom G. The arrow in panel D indicates β-sheet structure in the
cytosolic domain (From Liao et al. 2013, # 2013 Macmillan Publishers Limited, Nature. All rights
reserved).
12.3 The Use of Amphipols for Membrane Protein Electron Microscopy Studies
567