

two further structures of A8-35-trapped TRPV1 were solved, with either of two ligands bound, a
peptide toxin and capsaicin, respectively, at 3.8-Å and 4.2-Å resolution, visualizing the conformational
changes that lead to channel opening (Cao et al. 2013b).
It is interesting to note that TRPV1 was subsequently studied in nanodiscs (NDs) to a somewhat
higher resolution (unliganded, agonist-bound, and antagonist-bound states at resolutions of 3.2, 2.9,
and 3.4 Å, respectively), in order to examine protein/lipid interactions (Gao et al. 2016). Improvements
in resolution were not limited to TM regions, but also extended to cytoplasmic domains. These
improved density features may reflect enhanced stability of the channel in NDs, but other technical
advances also contribute. The ND- and APol-stabilized structures of a given conformational state are
essentially identical, albeit with some specific differences that may relate to lipid and/or ligand binding
(Gao et al. 2016).
Detailed views of the APol belt surrounding the TM region of TRPV1 are presented in Liao et al.
(2014) (Fig. 12.23). They feature two interesting differences with the APol belt visualized in the
respirasome study (Althoff et al. 2011) (Fig. 12.19A). First, the belt does not present the characteristic
bumps observed in the earlier study. This point will be commented upon in § 12.3.4.1. Second, there
A
B
C
D
E
F
G
H
I
I
I
J
K
L
M
N
O
P
Q
R
R
S
Resolution (Å)
100
63
40
25
16
10
6.3
4.0
2.5
1.6
0
0 . 5
1
1 . 5
2
2 . 5
Molecular mass (MDa)
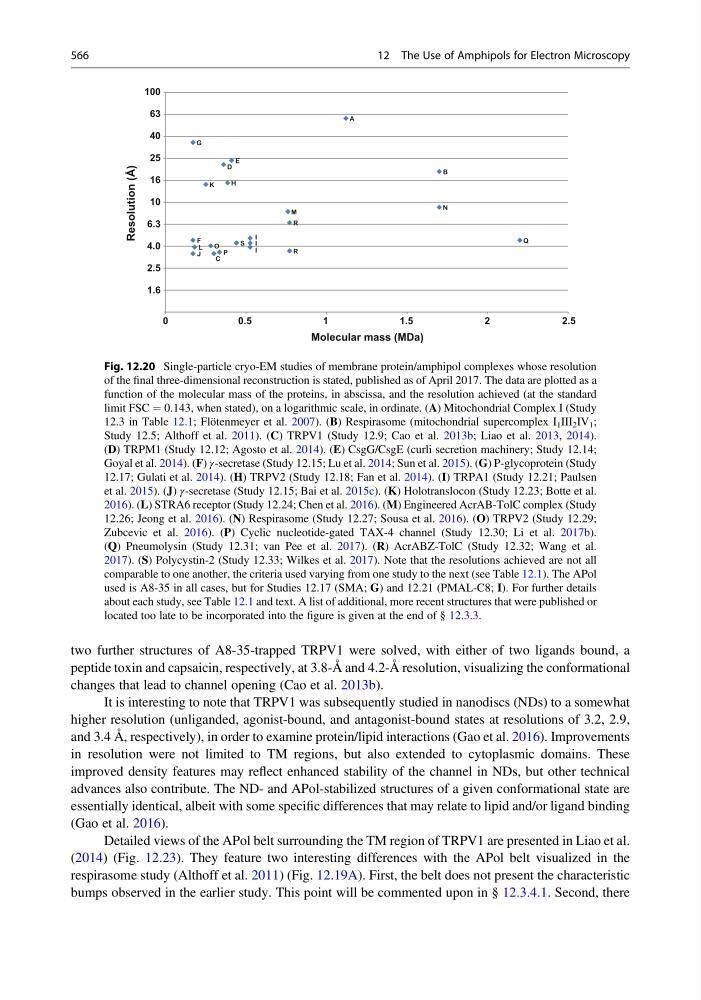
Fig. 12.20 Single-particle cryo-EM studies of membrane protein/amphipol complexes whose resolution
of the final three-dimensional reconstruction is stated, published as of April 2017. The data are plotted as a
function of the molecular mass of the proteins, in abscissa, and the resolution achieved (at the standard
limit FSC ¼ 0.143, when stated), on a logarithmic scale, in ordinate. (A) Mitochondrial Complex I (Study
12.3 in Table 12.1; Flötenmeyer et al. 2007). (B) Respirasome (mitochondrial supercomplex I 1 III 2 IV 1 ;
Study 12.5; Althoff et al. 2011). (C) TRPV1 (Study 12.9; Cao et al. 2013b; Liao et al. 2013, 2014).
(D) TRPM1 (Study 12.12; Agosto et al. 2014). (E) CsgG/CsgE (curli secretion machinery; Study 12.14;
Goyal et al. 2014). (F) γ-secretase (Study 12.15; Lu et al. 2014; Sun et al. 2015). (G) P-glycoprotein (Study
12.17; Gulati et al. 2014). (H) TRPV2 (Study 12.18; Fan et al. 2014). (I) TRPA1 (Study 12.21; Paulsen
et al. 2015). (J) γ-secretase (Study 12.15; Bai et al. 2015c). (K) Holotranslocon (Study 12.23; Botte et al.
2016). (L) STRA6 receptor (Study 12.24; Chen et al. 2016). (M) Engineered AcrAB-TolC complex (Study
12.26; Jeong et al. 2016). (N) Respirasome (Study 12.27; Sousa et al. 2016). (O) TRPV2 (Study 12.29;
Zubcevic et al. 2016). (P) Cyclic nucleotide-gated TAX-4 channel (Study 12.30; Li et al. 2017b).
(Q) Pneumolysin (Study 12.31; van Pee et al. 2017). (R) AcrABZ-TolC (Study 12.32; Wang et al.
2017). (S) Polycystin-2 (Study 12.33; Wilkes et al. 2017). Note that the resolutions achieved are not all
comparable to one another, the criteria used varying from one study to the next (see Table 12.1). The APol
used is A8-35 in all cases, but for Studies 12.17 (SMA; G) and 12.21 (PMAL-C8; I). For further details
about each study, see Table 12.1 and text. A list of additional, more recent structures that were published or
located too late to be incorporated into the figure is given at the end of § 12.3.3.
566
12 The Use of Amphipols for Electron Microscopy
peptide toxin and capsaicin, respectively, at 3.8-Å and 4.2-Å resolution, visualizing the conformational
changes that lead to channel opening (Cao et al. 2013b).
It is interesting to note that TRPV1 was subsequently studied in nanodiscs (NDs) to a somewhat
higher resolution (unliganded, agonist-bound, and antagonist-bound states at resolutions of 3.2, 2.9,
and 3.4 Å, respectively), in order to examine protein/lipid interactions (Gao et al. 2016). Improvements
in resolution were not limited to TM regions, but also extended to cytoplasmic domains. These
improved density features may reflect enhanced stability of the channel in NDs, but other technical
advances also contribute. The ND- and APol-stabilized structures of a given conformational state are
essentially identical, albeit with some specific differences that may relate to lipid and/or ligand binding
(Gao et al. 2016).
Detailed views of the APol belt surrounding the TM region of TRPV1 are presented in Liao et al.
(2014) (Fig. 12.23). They feature two interesting differences with the APol belt visualized in the
respirasome study (Althoff et al. 2011) (Fig. 12.19A). First, the belt does not present the characteristic
bumps observed in the earlier study. This point will be commented upon in § 12.3.4.1. Second, there
A
B
C
D
E
F
G
H
I
I
I
J
K
L
M
N
O
P
Q
R
R
S
Resolution (Å)
100
63
40
25
16
10
6.3
4.0
2.5
1.6
0
0 . 5
1
1 . 5
2
2 . 5
Molecular mass (MDa)
Fig. 12.20 Single-particle cryo-EM studies of membrane protein/amphipol complexes whose resolution
of the final three-dimensional reconstruction is stated, published as of April 2017. The data are plotted as a
function of the molecular mass of the proteins, in abscissa, and the resolution achieved (at the standard
limit FSC ¼ 0.143, when stated), on a logarithmic scale, in ordinate. (A) Mitochondrial Complex I (Study
12.3 in Table 12.1; Flötenmeyer et al. 2007). (B) Respirasome (mitochondrial supercomplex I 1 III 2 IV 1 ;
Study 12.5; Althoff et al. 2011). (C) TRPV1 (Study 12.9; Cao et al. 2013b; Liao et al. 2013, 2014).
(D) TRPM1 (Study 12.12; Agosto et al. 2014). (E) CsgG/CsgE (curli secretion machinery; Study 12.14;
Goyal et al. 2014). (F) γ-secretase (Study 12.15; Lu et al. 2014; Sun et al. 2015). (G) P-glycoprotein (Study
12.17; Gulati et al. 2014). (H) TRPV2 (Study 12.18; Fan et al. 2014). (I) TRPA1 (Study 12.21; Paulsen
et al. 2015). (J) γ-secretase (Study 12.15; Bai et al. 2015c). (K) Holotranslocon (Study 12.23; Botte et al.
2016). (L) STRA6 receptor (Study 12.24; Chen et al. 2016). (M) Engineered AcrAB-TolC complex (Study
12.26; Jeong et al. 2016). (N) Respirasome (Study 12.27; Sousa et al. 2016). (O) TRPV2 (Study 12.29;
Zubcevic et al. 2016). (P) Cyclic nucleotide-gated TAX-4 channel (Study 12.30; Li et al. 2017b).
(Q) Pneumolysin (Study 12.31; van Pee et al. 2017). (R) AcrABZ-TolC (Study 12.32; Wang et al.
2017). (S) Polycystin-2 (Study 12.33; Wilkes et al. 2017). Note that the resolutions achieved are not all
comparable to one another, the criteria used varying from one study to the next (see Table 12.1). The APol
used is A8-35 in all cases, but for Studies 12.17 (SMA; G) and 12.21 (PMAL-C8; I). For further details
about each study, see Table 12.1 and text. A list of additional, more recent structures that were published or
located too late to be incorporated into the figure is given at the end of § 12.3.3.
566
12 The Use of Amphipols for Electron Microscopy